Precious Metals Analysis Using Andrews Pitchforks And Fibonacci Techniques


Gold and Silver have become overbought in recent weeks along with many of the mining stocks. On Friday the sector took a turn lower with Gold and Silver both dropping through major support levels.
Our trading plan doesn’t allow for shorting the precious metals sector…so at this point we are waiting for the pullback to complete before taking new long positions.
If you are accumulating the sector on weakness, the following symbols are displaying relative strength: NEM, SLW, CDE, HL and PAAS.
ETFs & Indexes
GLD – SPDR Gold Trust – daily chart

GLD dropped through support at both the 200 and 50-day exponential moving averages (EMA) as well as the horizontal support / resistance level. There is potential support at the lower median line of the blue Andrews pitchfork and the minor horizontal support / resistance level.
~
SLV – iShares Silver Trust – daily chart

SLV dropped through support at the 50-day EMA to test support at the lower median line of the blue Andrews pitchfork and the horizontal support / resistance level.
~
GDX – Market Vectors Gold Miners ETF – daily chart
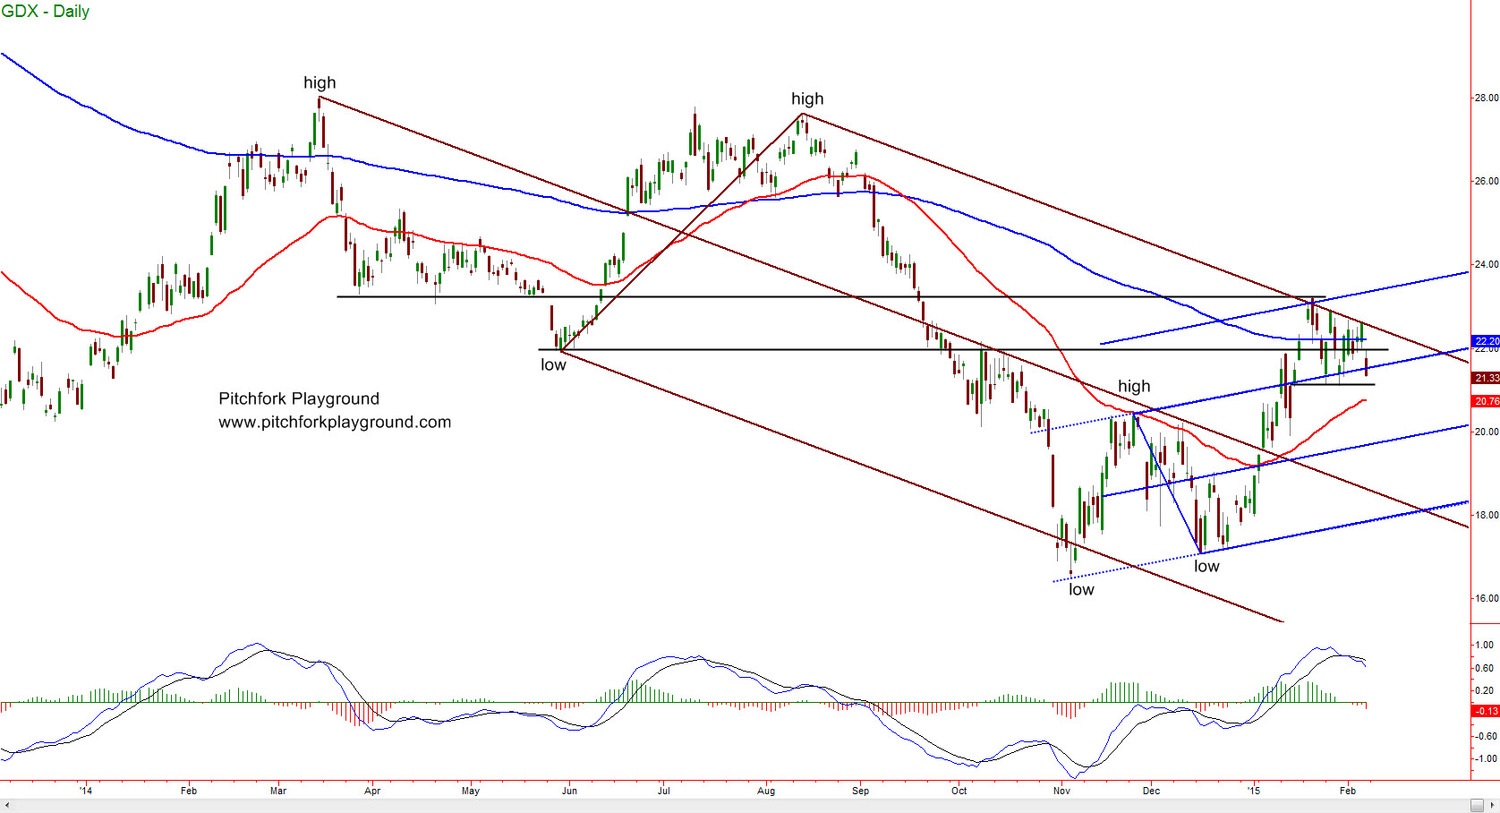
GDX closed above the 200 day EMA on Thursday but gapped lower on Friday penetrating support on the moving average as well as the horizontal support / resistance level. The downward move also penetrated the upper median line of the blue modified-Schiff pitchfork with price closing below that level. Potential support comes in at the minor horizontal support / resistance level and the 50-day EMA below that.
~
GDXJ – Market Vectors Jr. Gold Miners ETF – daily chart

GDXJ dropped below the 50-day EMA and the lower median line of the blue Andrews pitchfork. The next support level occurs at the minor horizontal support / resistance line. Furthermore, the MACD histogram was rising towards zero until Friday.
~
CEF – Central Fund of Canada – daily chart

CEF gapped lower Friday penetrating the 200 day EMA and the horizontal support / resistance level. Price found support on the upper median line of the blue modified-Schiff pitchfork and the 50-day EMA Friday’s bar is an interesting doji showing that buyers and sellers did battle and the buyers came out slightly ahead. Price closed Friday above a minor support / resistance level.
~
HUI – ARCA Gold Bugs Index – daily chart

(click for full-size chart)
HUI dropped through support along the upper median line of the red Andrews pitchfork to potential support at the median line of the blue Andrews fork.
Gold Miners
GG – Goldcorp – daily chart
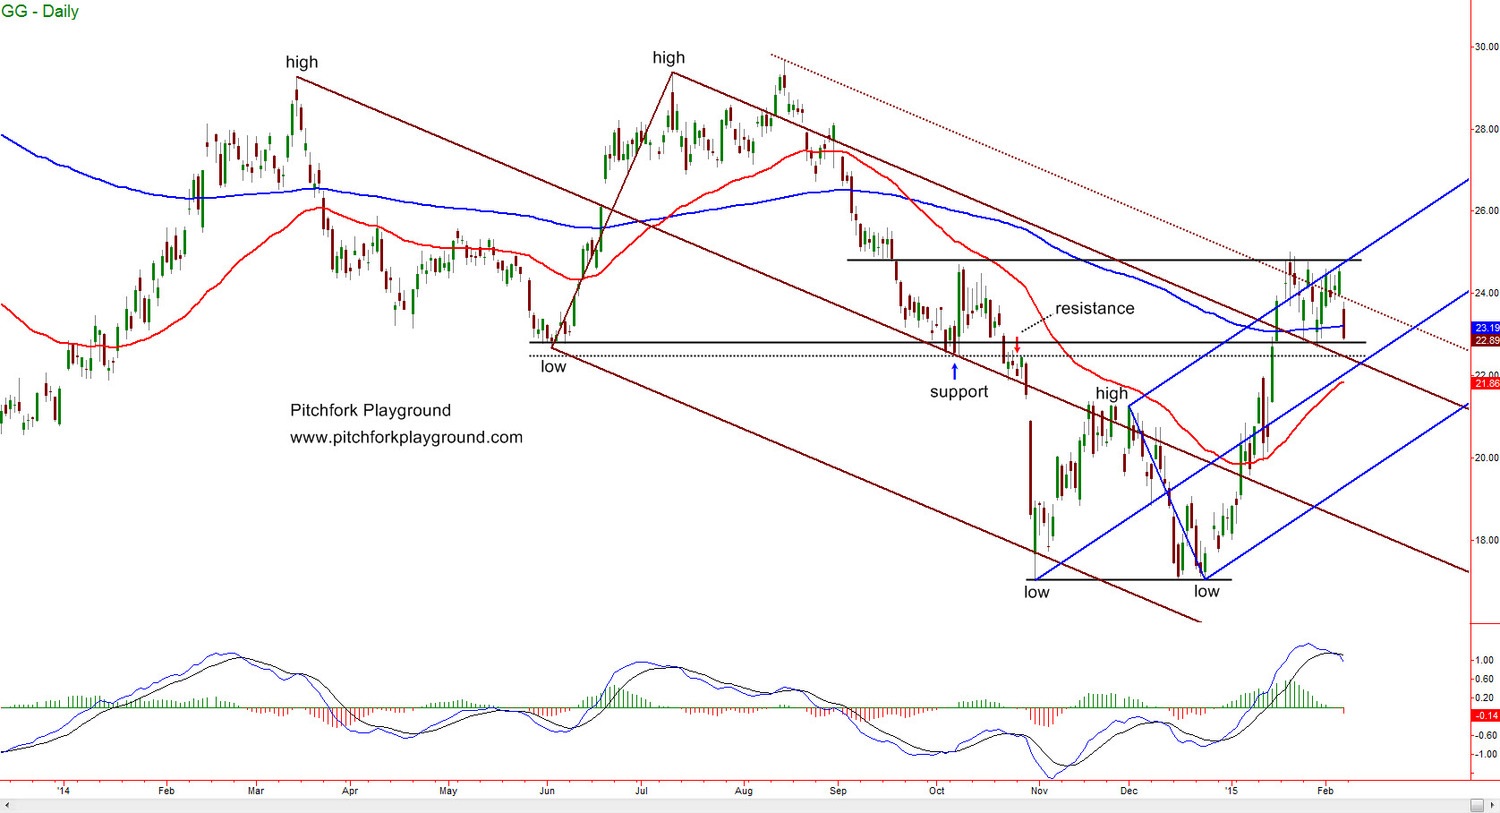
GG gapped lower on Friday and penetrated the 200-day EMA, as the price closed above a level where support has been found recently (solid line). It is imperative to notice that the support / resistance line is actually a little lower (dashed line) – lines that get tested from both sides, like the dashed line, tend to be revisited in the future. The test of this dashed line would also allow price to test support on the upper median line of the red Andrews fork and the median line of the blue Andrews fork.
~
KGC – Kinross Gold – daily chart

KGC is pulling back to test support at the 50-day EMA, the lower median line of the blue modified-Schiff pitchfork and the horizontal support level.
~
NEM – Newmont Mining – daily chart

NEM gapped lower Friday to test support on the horizontal support / resistance level. The doji candle shows that buyers and sellers fought each other and neither side could gain an advantage.
Silver Miners
SLW – Silver Wheaton – daily chart

SLW has been one of the stronger mining stocks for months – there are five rules or guidelines for us to follow when we are working with Andrews pitchforks – one of them says that price is always targeting the next median line. This means that back in November when price dropped through the red fork’s median line and plunged lower, the target for the move was the lower median line around $14.60. The fact that price found support and turned back higher without testing the lower median line is a sign of strength. It is to be noticed that from that low point, SLW has been making a series of higher lows and higher highs which defines an uptrend.
Another sign of strength in SLW is that all of the recent action has occurred above the 200-day EMA, where price found support at the EMA on Friday. The long wick above the body of Friday’s candle tells us that sellers were in charge.
~
CDE – Coeur Mining – daily chart
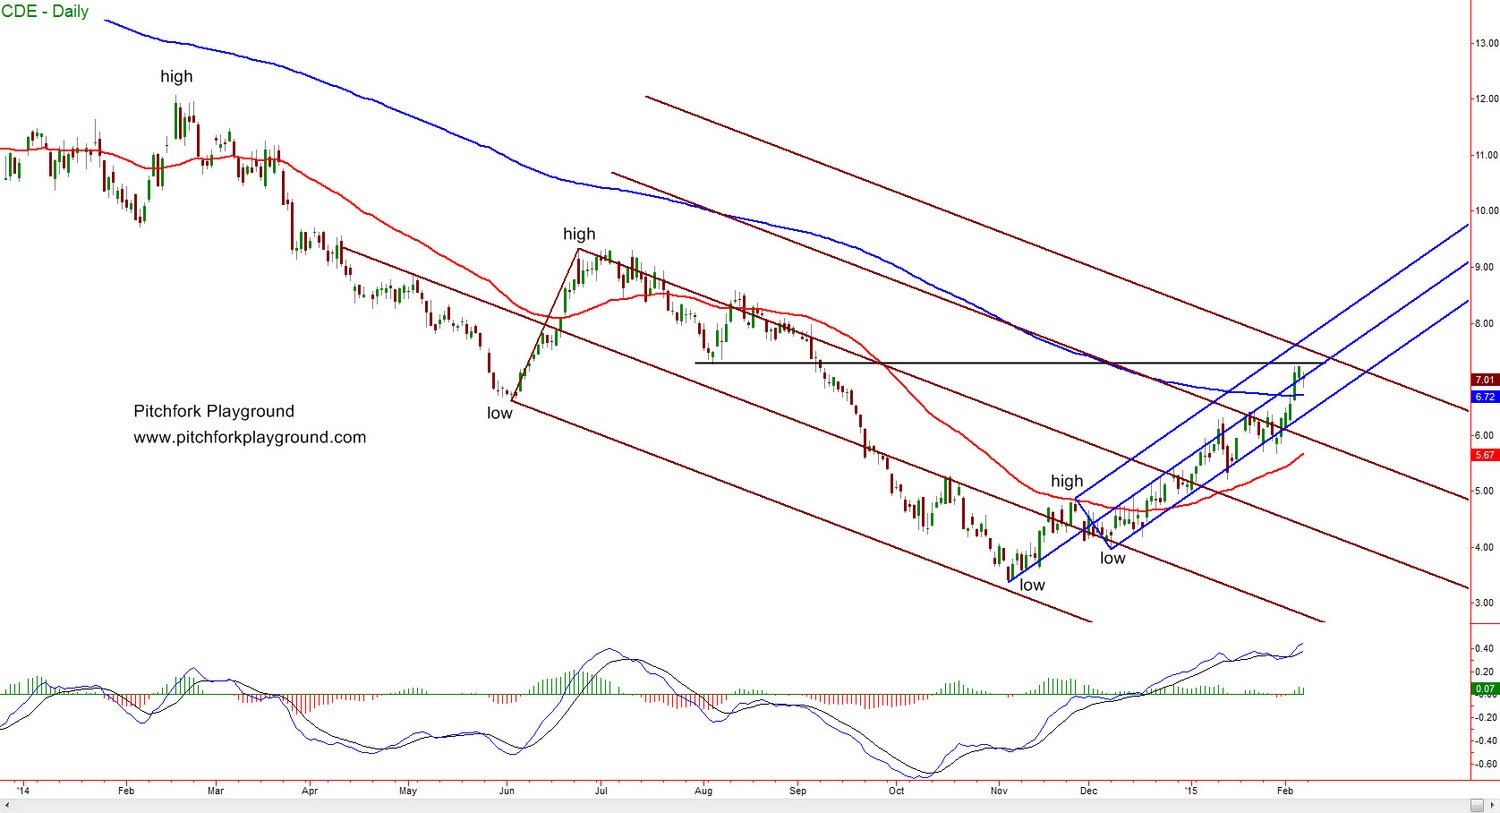
CDE is a relative strength leader with price remaining above the 200-day EMA – notice also that the MACD histogram is above zero in contrast to most of the other miners. Friday’s candle is a doji with the body right at the median line of the blue Andrews pitchfork.
~
HL – Hecla Mining – daily chart

HL is relatively strong. It is the only chart where the 50-day EMA has crossed above the 200-day average – like SLW all of the recent action has occurred above the 200-day EMA. Price has pulled back to the lower median line of the blue Andrews pitchfork and the horizontal support / resistance level.
~
PAAS – Pan American Silver – daily chart
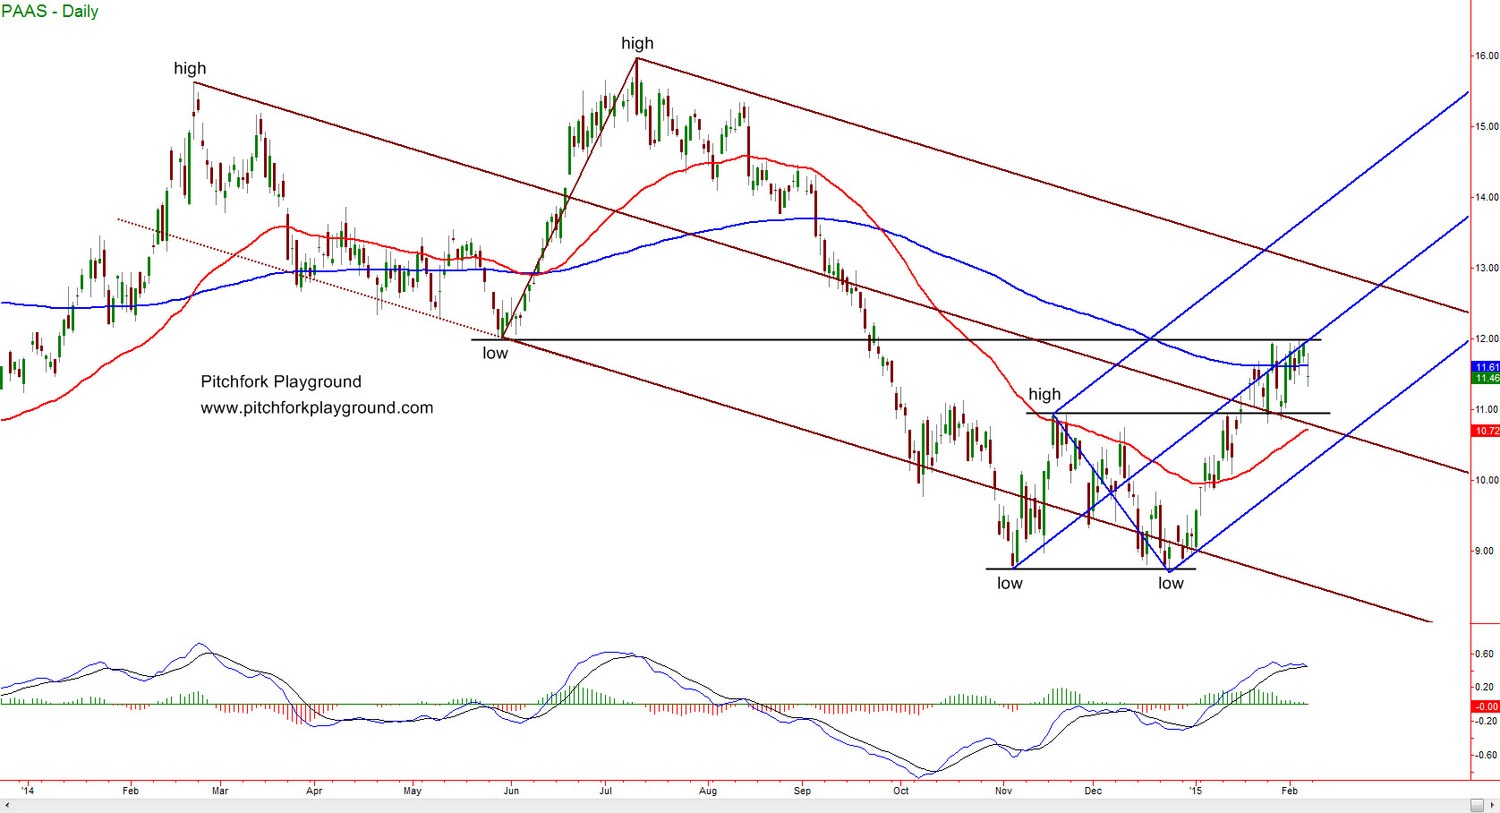
PAAS gapped lower through the 200-day EMA on Friday. Buyers took price higher after the open but sellers came in and pushed price back down. Pan American, like some of the other silver stocks, is showing relative strength, while the MACD histogram remains above zero. And we haven’t gotten a MACD sell signal yet
~
SSRI – Silver Standard Resources – daily chart
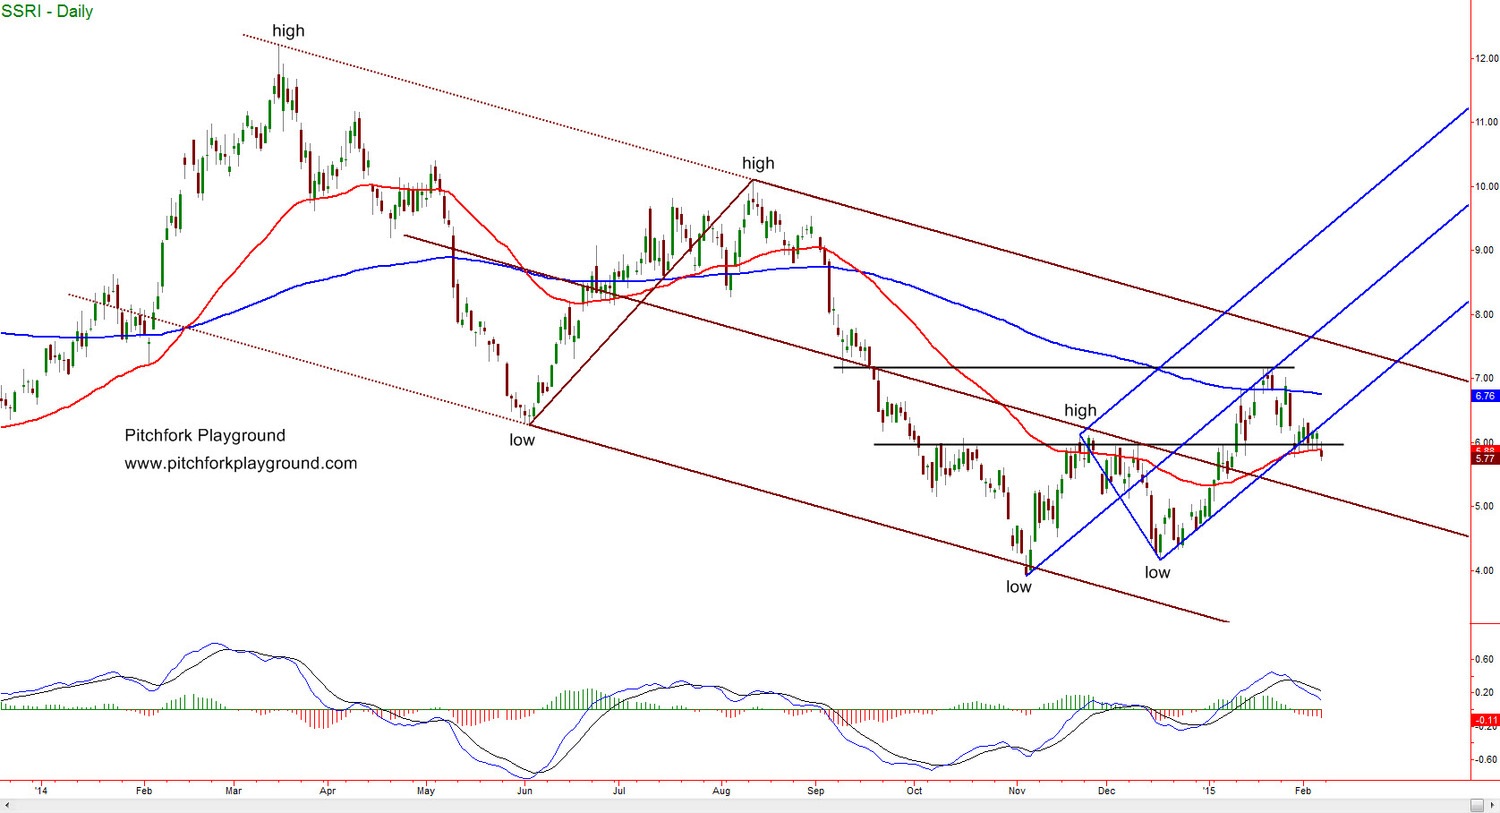
SSRI dropped through both the 50-day EMA and the horizontal support / resistance level Friday – earlier in the week price fell through support along the lower median line of the blue Andrews pitchfork.
~
The precious metals and the mining stocks remain in a long-term downtrend. We may be seeing the beginning of a new bull phase but caution is warranted. The sector became overbought in recent weeks and we are seeing a pullback. Price will show us where it wants to go next as the current decline plays out and finds support. If you are accumulating on weakness stick with the relative strength leaders.
“When you recall that one of the first moves by Lenin, Mussolini, and Hitler was to outlaw individual ownership in gold, you begin to sense that there may be some connection between money, redeemable in gold, and the rare prize known as human liberty.” ~ Congressman Howard Buffett (Warren Buffet’s father)
********
Courtesy of http://www.pitchforkplayground.com/


