Precious Metals Sector Downside Target On Market Rout - Strategies...


After what happened on Friday many Precious Metals sector investors are naturally concerned about the effect of further heavy losses in the broad market on the sector. Let’s now review Friday’s action, starting with the broad market itself, before moving on to consider the likely impact on the PM sector.
After almost two months of quietly drifting sideways, the ground opened up beneath the broad market on Friday, as we can see on the 6-month chart for the S&P500 index below, it gapped down at the open and plunged by 2.45%, heading ever lower as the day unfolded – there was not even the customary bounce in the last hour of trading. This was predicted on the site back on 1st September when we had correctly identified what kind of pattern was forming, in the article Complacency Rife As Very Dangerous Pattern Completes In S&P500, a Dumpling Top, although at that time it was not known what sort of collateral impact this would have on the PM sector. This was a severe and decisive breakdown and there was almost no place to hide – most everything tanked, with the exception of the dollar and some obscure paper of the Czech Republic, I believe. Bonds plunged and yields rose, and it is thought that this may mark, at long last, the start of a rate tightening cycle, necessary to the survival of a number of banks. Of course, should the rate rises occur, can only be miniscule, otherwise the entire system will implode. If it does mark the start of a tightening cycle, then bonds and stocks are in for a really rough ride.
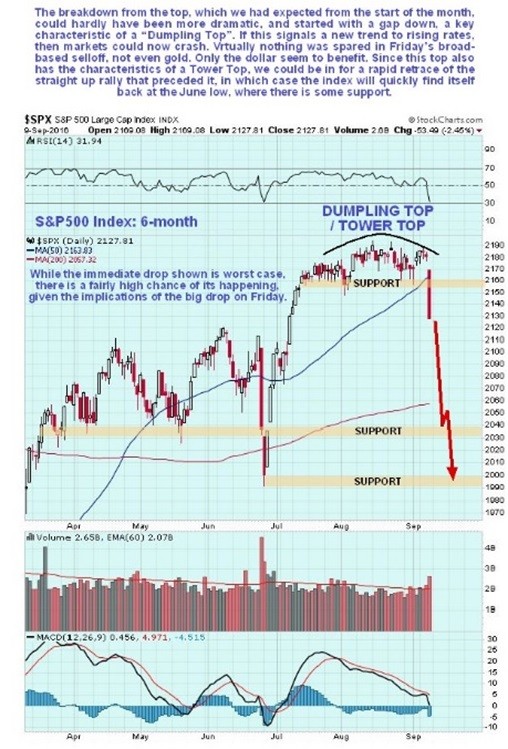
The decisive breakdown in the stock market on Friday (09/09/16) probably marks the start of a severe downtrend. How far will it drop? It should drop in short order to at least the 2030 – 2040 level, where there is support, and could easily continue lower to the next support level in the 1990 – 2000 area. This latter objective is made more likely by the top pattern also having the attributes of a Tower Top, where the sharp rise out of the June lows to form the left side of the tower is now mirrored by a precipitous decline to complete the right side of the tower. This drop, should it occur, will probably be the curtain raiser on a long and brutal bear market, that has been kept at bay for years now by Fed and government meddling.
If such a drop occurs in the broad market in coming weeks, what will be the effect on the PM sector? We have already seen the PM sector suffer quite severe collateral damage during yesterday’s mad scramble for the exits. While it doesn’t look all that much on the 1-year chart for GDX shown below, partly because the PM sector is much more volatile, the losses in the PM sector were double the losses in the broad market, not a good sign – while the S&P500 Index fell by nearly 2.5%, the PM sector fell by over 5%. This means that it is reasonable to expect further steep losses in the PM sector if the broad market continues to tank as expected. How far will it drop? – probably to the zone of strong support on the GDX chart in the $21 – $22 zone. While that might not look all that much from the current $26.40, it will involve a good many stocks showing further heavy losses. With this move the correction should end. Moreover, it is important to note that such a drop would not cause any technical damage, since GDX (and PM stock indices) would only be dropping to their rising 200-day moving averages. On the contrary, by rebalancing sentiment and shaking out weak investors, it will set it up for the next big upleg. After a big plunge the stock market will probably grind lower in a more measured manner, whereupon the PM sector is likely to go contra-cyclical and rally. This correction now appears to be taking the form of a classic 3-wave A-B-C correction as shown on the chart, and the C-wave to the support should mark the end of it.
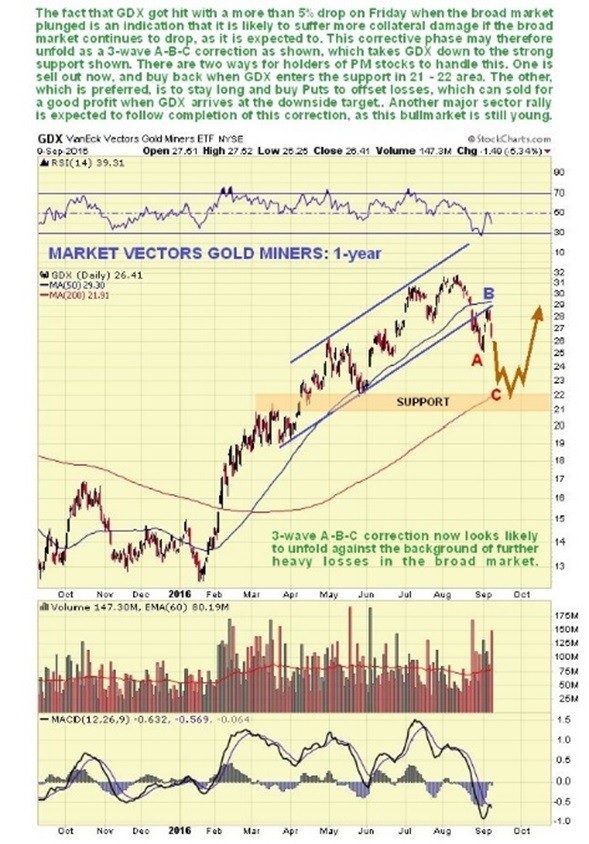
How should holders of PM stocks handle this correction? Most important of all is realizing first off that it is only a correction. Therefore, it should help by having an idea of where it is likely to end (as set out here). There are several ways to handle it depending on what type of investor or trader you are. One approach is to sell holdings now, assuming the sector doesn’t open heavily down on Monday…with the aim of buying them back when GDX drops into the support zone. However, this approach risks being left stranded if the sector turns up from here. Another is to sit tight and tough it out, in the knowledge that prices will recover again, once the next major upleg gets started. However, perhaps the best approach for those set up to use this strategy, given that we have a good idea of the downside target, is to insulate your positions from loss using Puts. If the Puts are sold for a profit once GDX drops into the support, and the sector subsequently recovers as expected, so that there are no losses in the stocks, the Puts will have provided a windfall profit.
********
Courtesy of Courtesy of http://www.clivemaund.com

Clive P. Maund’s interest in markets started when, as an aimless youth searching for direction in his mid-20’s, he inherited some money. Unfortunately it was not enough to live a utopian lifestyle as a playboy or retire very young. Therefore on the advice of his brother, he bought a load of British Petroleum stock, which promptly went up 20% in the space of a few weeks. Clive sold them at the top…which really fired his imagination. The prospect of being able to buy securities and sell them later at a higher price, and make money for doing little or no work was most attractive – and so the quest began, especially as he had been further stoked up by watching from the sidelines with a mixture of fascination and envy as fortunes were made in the roaring gold and silver bull market of the late 70’s.
Clive furthered his education in Technical Analysis or charting by ordering various good books from the US and by applying what he learned at work on an everyday basis. He also obtained the UK Society of Technical Analysts’ Diploma.
The years following 2005 saw the boom phase of the Gold and Silver bull market, until they peaked in late 2011. While there is ongoing debate about whether that was the final high, it is not believed to be because of the continuing global debasement of fiat currency. The bear market since 2011 is viewed as being very similar to the 2-year reaction in the mid-70’s, which was preceded by a powerful advance and was followed by a gigantic parabolic price ramp. Moreover, Precious Metals should come back into their own when the various asset bubbles elsewhere burst, which looks set to happen anytime soon.
Visit Clive at his website: CliveMaund.com


