Precious Metals Sector Due For Bounce…But…


 The precious metals sector has declined sharply in recent weeks with no pause or intermittent breaks in the decline. Including today, Gold is down eight consecutive days and 16 of the past 18 days. The gold miners (GDX) have lost roughly 20% in the past seven days. The sector is extremely oversold in the short term and a reflex rally could begin in the next few days. While Gold and gold bugs should get temporary relief, the larger picture remains quite bearish.
The daily candle charts of Gold and GDX are included in the image below. (Note that Gold is not updated today). Gold which has traded as low as $1084/oz today, has support in the $1080/oz to $1100/oz zone. Meanwhile, GDX after gapping lower today found support around $13.50. GDX has good support in the $13.00 to $13.50 area. Gold and gold stocks are very oversold and have reached levels at which a bounce could begin.

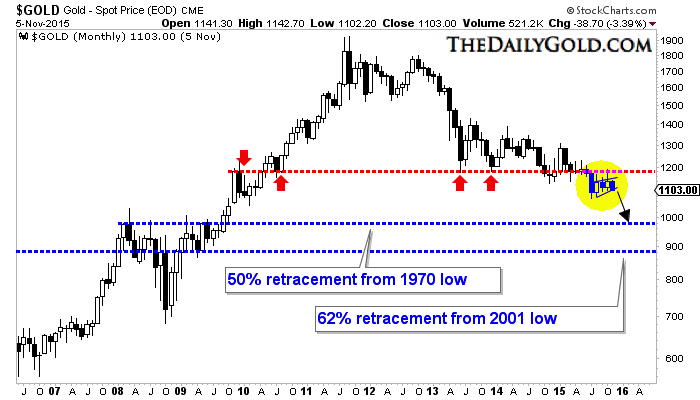
While Gold and gold shares are likely to rally in the days ahead, the overall prognosis remains decidedly bearish. Consider the monthly candle chart for Gold. Monthly charts carry more weight than weekly charts and much more weight than daily charts. Gold appears to be breaking down from the bearish flag pattern formed in recent months. After plunging in July, Gold rallied in weak fashion and failed one last time at major resistance of $1180/oz. The flag projects to a downside target of roughly $1035/oz. Ultimately, the bear market could end at one of the two targets shown in the chart, $970/oz or $890/oz.
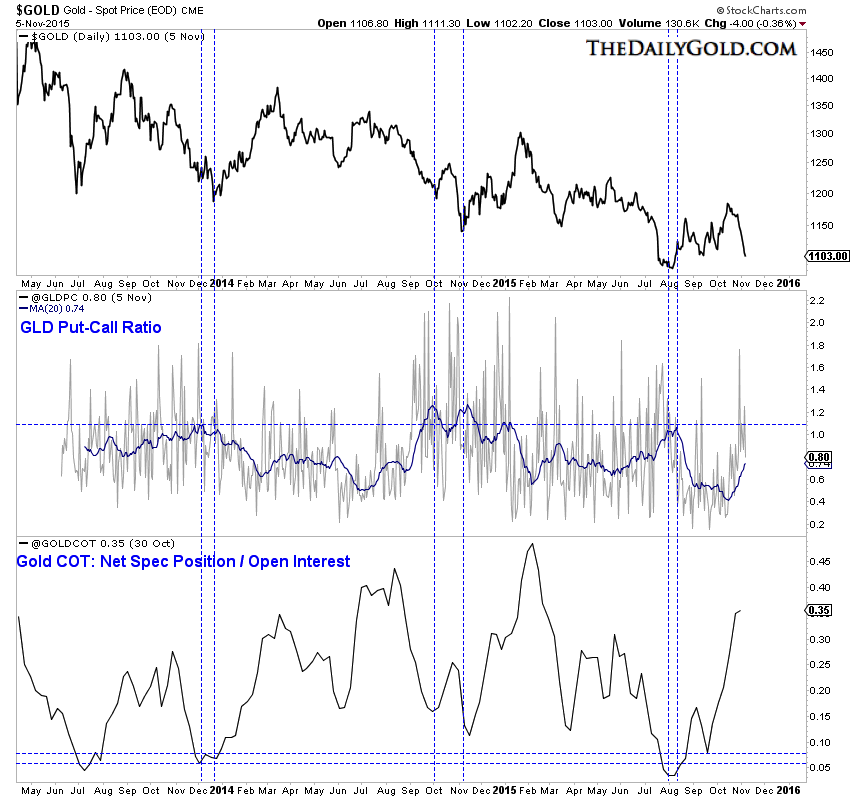
Sentiment indicators are one set of indicators that can help us gauge when Gold is due for a rebound or when the bear market could end. In the chart below we include the GLD put-call ratio (smoothed with a 20-day moving average) and the net speculative position in the futures market. We measure that position as a percentage of open interest. As you can see, the two sentiment indicators are not yet close to bearish extremes. The smoothed put-call ratio is at 0.74 which is well below the 1.10 level that has corresponded with the lows of the past two years. Meanwhile, the net speculative position of 35% (which I’m guessing will be below 25% after this week) remains way too high. Plenty of speculators are left to cut positions and push Gold lower.
The final collapse or final capitulation in Gold that has eluded us for a few years appears to be in motion. After an oversold bounce, Gold should test support at $1080/oz and finally threaten the key $1000/oz support level. Last week we warned: The specter of $950 to $1000 Gold looms larger now and readers are advised to cut losses and prepare portfolios for the bearish scenario. We took profits on our shorts today and will re enter on strength. The conditions that will bring about a buying opportunity and the end of the bear market (extreme bearish sentiment, extreme oversold conditions and strong technical support) are not yet present but could develop in the weeks and months to come.
********
Jordan Roy-Byrne, CMT

Jordan Roy-Byrne, CMT is a Chartered Market Technician and member of the Market Technicians Association. He is the publisher and editor of TheDailyGold Premium, a publication which emphasizes market timing and stock selection, as well as TheDailyGold Global, an add-on service for subscribers which covers global capital markets. He is also the author of the 2015 book, The Coming Renewal of Gold’s Secular Bull Market which is available for free. TheDailyGold.com was recently named one of the top 50 Investment Blogs by DailyReckoning and WalletHub.


