Psychological Warfare In The Precious Metals vs The Big Picture


Tonight we’ll look at the precious metals complex to see how this game of psychological warfare looks from a Chartology perspective. I know many are disappointed by the short-covering rally at the end of Friday’s trading, but this is how markets work. They do everything they can to throw you off the trade -- and just when you think you have it figured out, it will change again. The big question is did this short covering rally change the bigger picture? If one just looks at the very short minute charts they will see the end of the day rally as being pretty significant but the further you go out in time the less it affects the appearance of the chart.
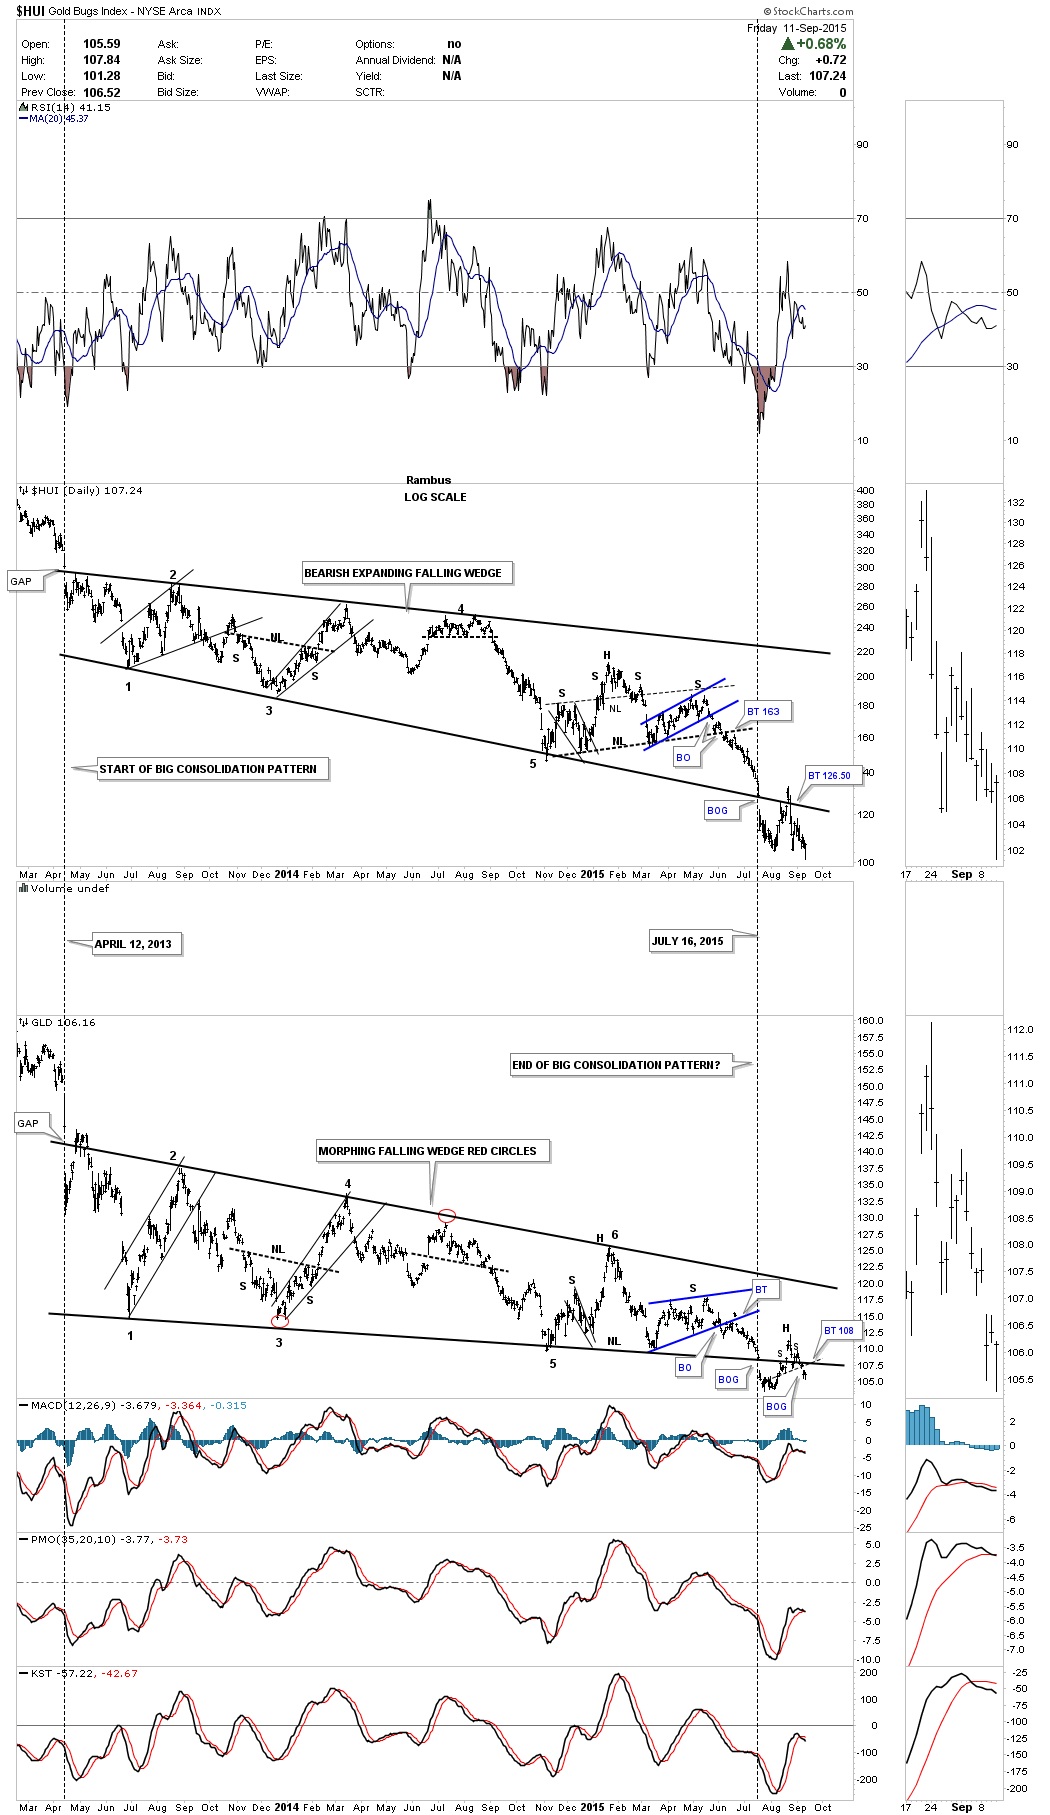
Let’s start by looking at the combo chart for the HUI and GLD that we’ve been following for a long time now. Both the HUI and GLD started their 27 months consolidation patterns on the same day back in April 2013. They both broke below their respective bottom trendlines on the same day on July 16th of this year. That big breakout occurred on very heavy volume with a big breakout gap. The breakout is now almost two months in the making. Remember how you felt when the HUI gapped back above the bottom rail of its big bearish expanding falling wedge? How could this be with such a perfect breakout? Now when you look at the HUI chart on top that move back above the bottom rail doesn’t look so terrible now as the HUI made a new multi-year low at one point today.
The GLD chart at the bottom stayed inside of its bearish falling wedge a little longer than the HUI did but this week it broke back below its bottom trendline. You can see it made a small H&S pattern right on the bottom rail. It’s now in the process of back-testing both trendlines which would come in around the 108 area. This combo chart shows nothing is broken yet with these two stocks only short sellers spirits.
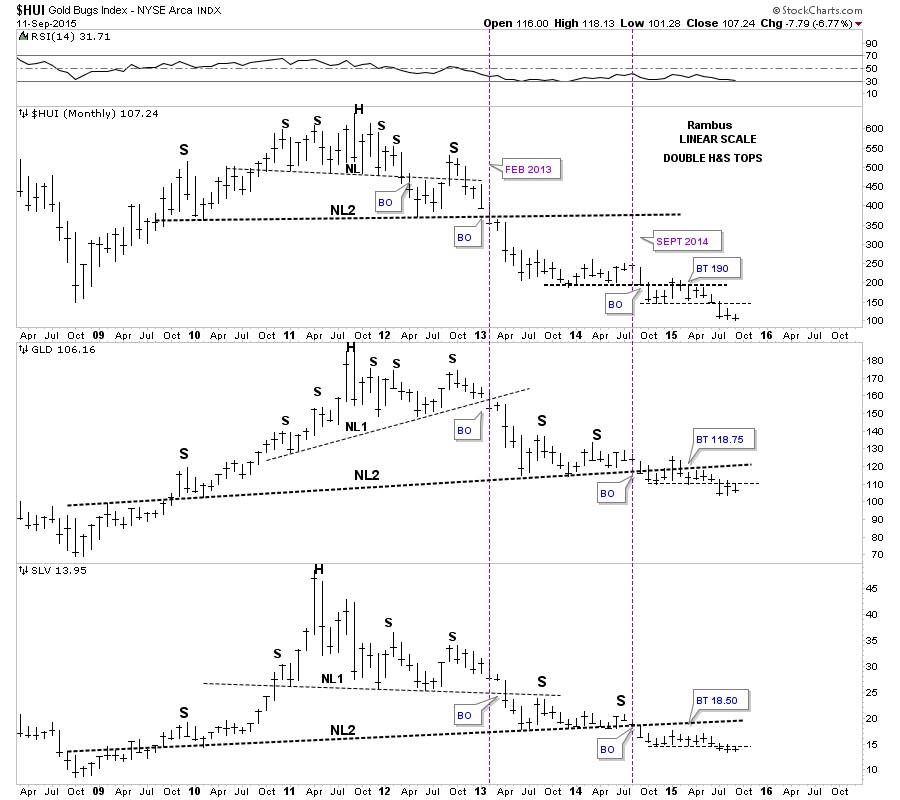
Below is a triple combo chart which has the HUI on top, GLD in the middle and SLV on the bottom. This is a comparison chart which shows you how they tend to move together. It’s not a perfect correlation but pretty close. This chart makes it very clear that the HUI has been leading the metals lower as it was the first one to breakout of its smaller H&S #1 neckline. As you can see all three formed a double H&S top. Almost exactly one year ago both GLD and SLV broke below their neckline #2 and have been back-testing it ever since. That’s almost a whole year of chopping sideways going basically nowhere. The main takeaway from this chart is that the big neckline #2 has held resistance for GLD and SLV. As you can see the HUI and SLV are trading at multi year lows for the month of September with GLD not far behind.
What is striking about this triple combo chart is how much weaker the HUI has been vs the metals. I think this chart is giving us a pretty clear picture of which one of these three is going to bottom first. Note how much lower the price action is for the HUI vs GLD & SLV. GLD and SLV are still pretty close to their respective neckline #2 while the HUI is trading way below its neckline #2 in both time and price. So from a long term monthly perspective there is nothing remotely bullish about these three stocks as they’re basically trading at four year lows.
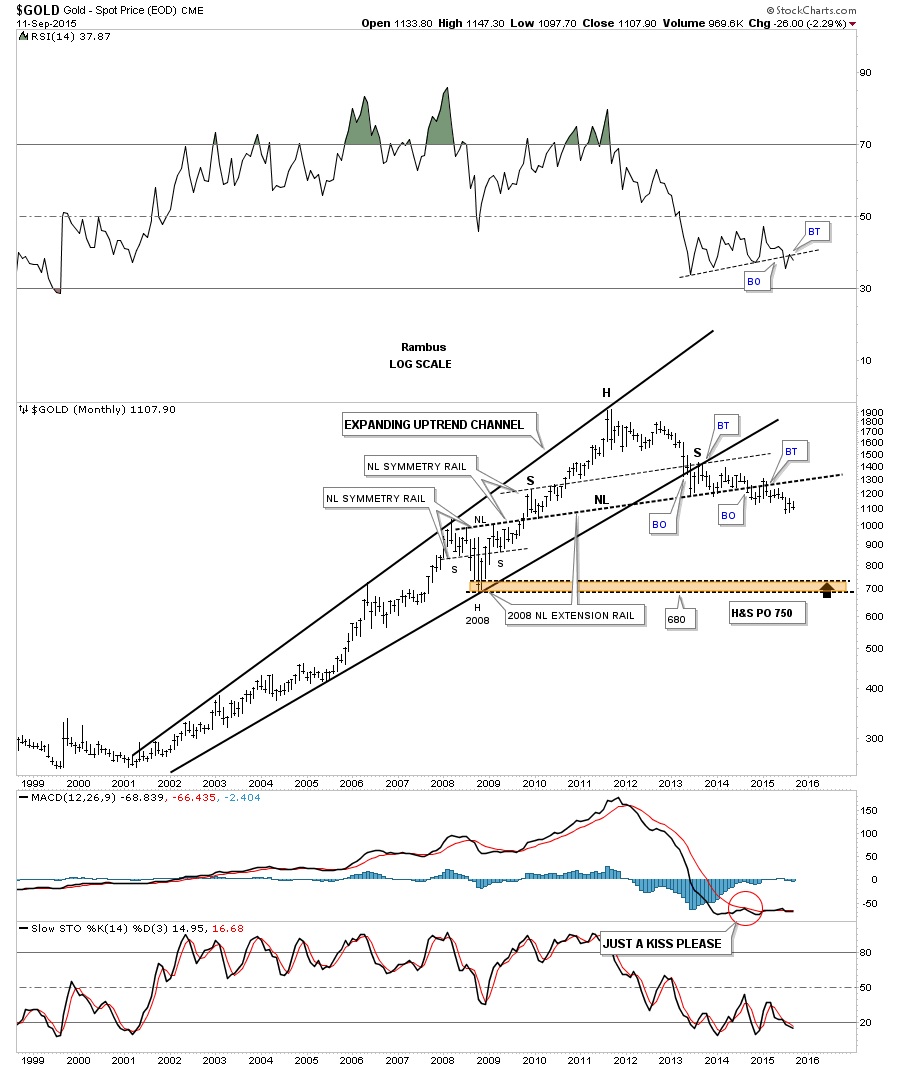
The next chart is a monthly look at gold which shows its bull market created and expanding rising wedge. It has a classic symmetrical H&S top as shown by the neckline symmetry line which shows the height for the left and right shoulders. Another interesting thing about that massive H&S top is how the left shoulder and head formed inside of the expanding rising wedge while the right shoulder formed as the bac-test to the underside of the bottom rail of the bearish expanding rising wedge. The brown shaded area shows the possible two price objectives. The massive H&S top measures down to the 750 area while the 2008 crash low comes in at the 680 area. It’s been close to two years now since I first posted the possibility for the massive H&S top which I know feels like an eternity for some of you but this is a very big pattern which takes time to setup the impulse move down. It’s impossible to chart every little wiggle a stock makes but the big picture for gold, I laid out a long time ago, is still working and nothing is broken. Just think for a moment of all the gold bugs that still don’t see the big picture that will eventually capitulate their shares at a lower price than today’s.
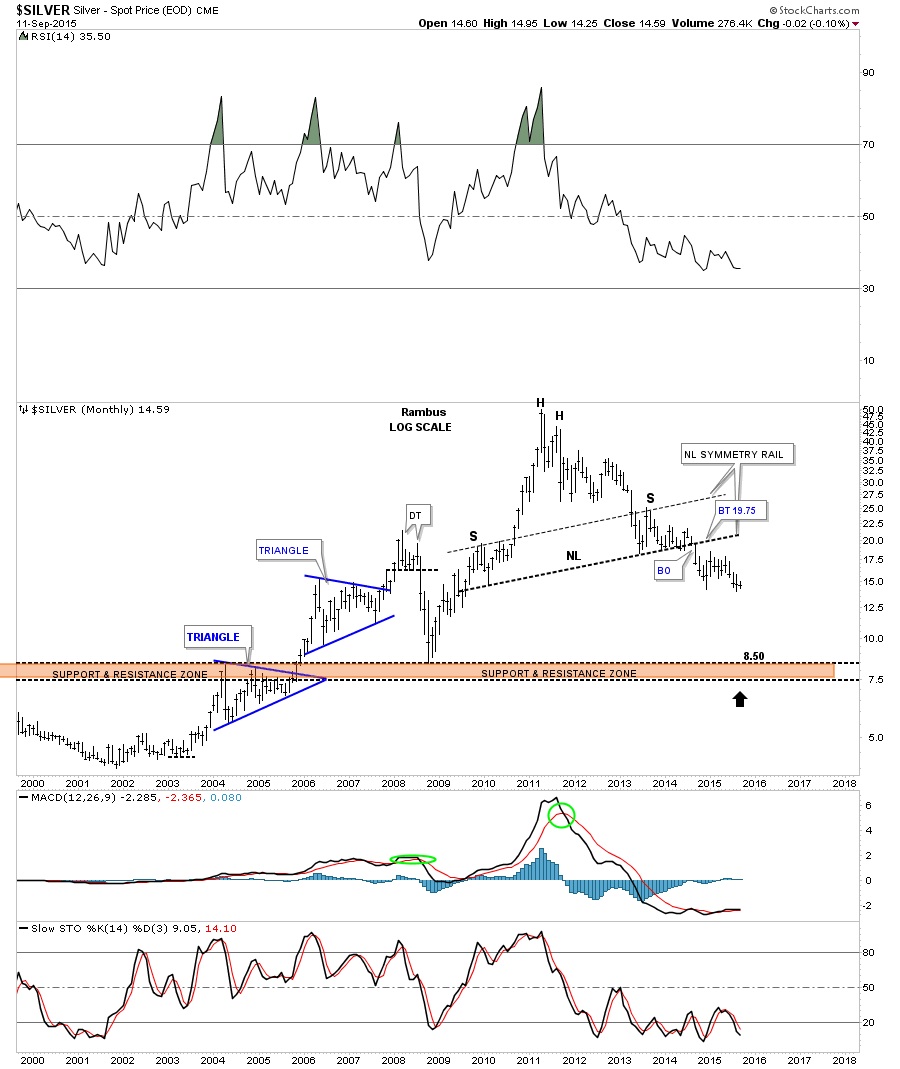
The long-term monthly chart for silver also shows a very symmetrical H&S top in place. The brown shaded S&R zone shows the price objective for the massive H&S top.
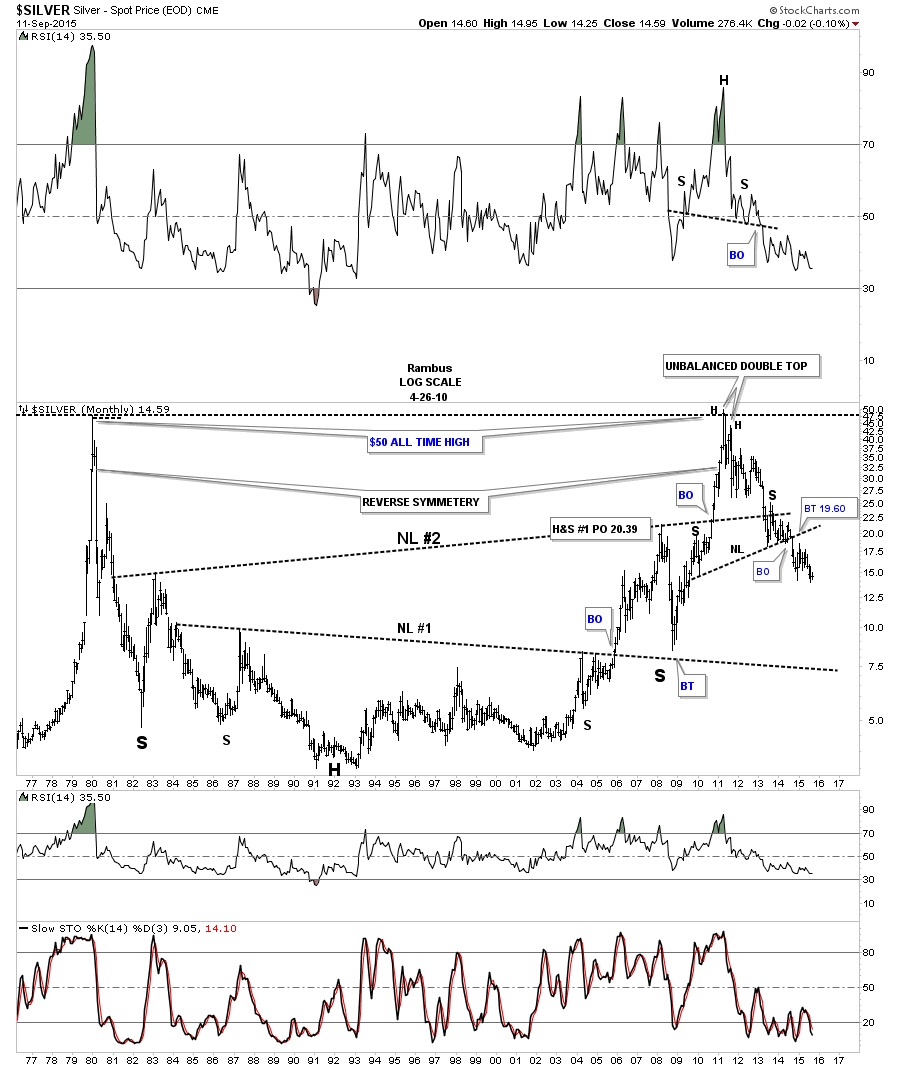
Let’s look at one last chart for tonight which is a 40-year monthly chart for silver. This chart shows some nice reverse symmetry going all the way back to the 1980 bull market peak at 50. You can also see the H&S top that I showed you on the shorter term monthly chart above on the far right hand side of the chart. I could be wrong but it looks like the price action is just suspended in thin air waiting for gravity to take it down. As always we’ll know in the fullness of time.
********
Courtesy of www.rambus1.com
 Meet Rambus, a seasoned trader and technical analyst renowned for his unbiased and insightful chart work. Through his website, Rambus Chartology, and Substack newsletter, Rambus shares his expertise with a global community of subscribers, providing daily updates, commentaries, and hands-on training in the art and science of chartology. With his calm, humble, and down-to-earth approach, Rambus demystifies complex market trends, helping his followers navigate the challenges of today's volatile markets. Join the Rambus Chartology community today and discover a unique blend of technical analysis, trading expertise, and time-tested protocols. Subscribe now at www.rambus1.com or https://rambuschartology.substack.com/


