Recent Corrections For Precious Metal Stocks Are Over


The Relevance Of Cycle Analysis
There are some debates as to the direction of the precious metal stocks and the gold and silver price. From the cycle perspective, we say that the recent corrections are over. The gold and gold stocks will now be resuming the rise.
In this article, we will review the big picture and the long term gold stock analysis first. The reader is encouraged to read our numerous articles published on this website. Our past work on the validity checks of our cycle analysis based on Fourier transformation has confirmed the usefulness of this approach in forecasting the price. After all, the price should in principle contain all the actions of the investor, and the government manipulators. This does not negate the usefulness of fundamental analysis and the traditional technical analysis.
The Big Picture
The following 2 charts are updates of our earlier analyses. They provide a good background to the daily analyses of various precious metal stocks presented in subsequent sections of this article,

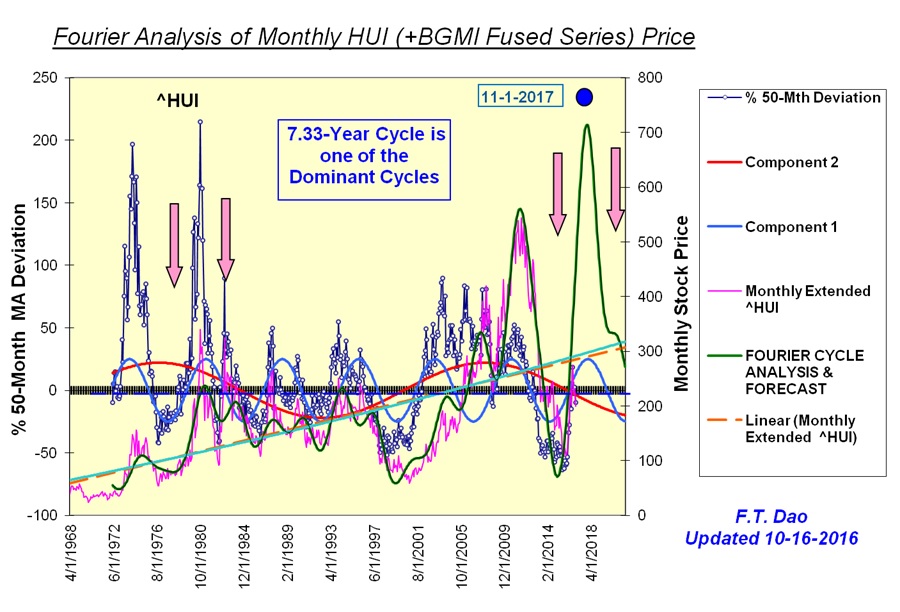
The key observations from the big picture are:
- The period from 2000 to 2020 is the generational period where gold will outperform the DOW equity market. This are the generational 20-year cycles discussed in our earlier articles. The recent corrections of gold and silver prices are normal.
- The more dramatic rise is shown in our updated monthly gold stock (HUI) chart. This extended HUI incorporates normalized BGMI data. We expect the current big rise will peak by the end of 2017. The rise of impending 2017 gold stock peak will be as dramatic as that of the 1980 peak.
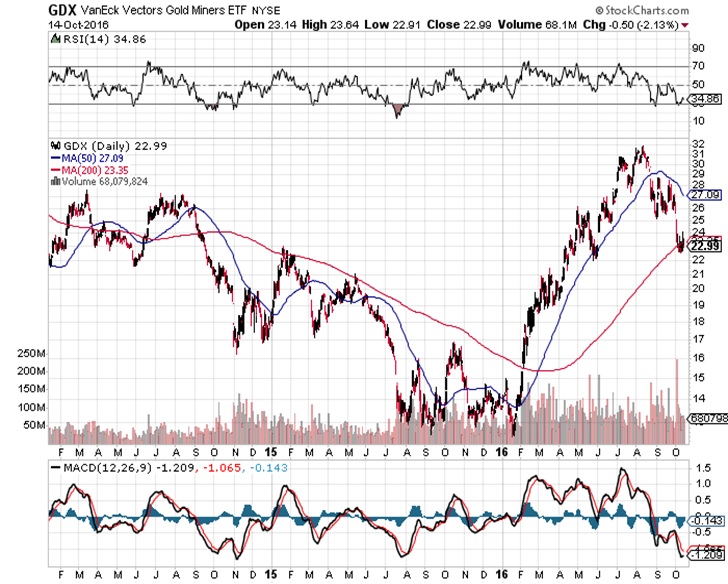
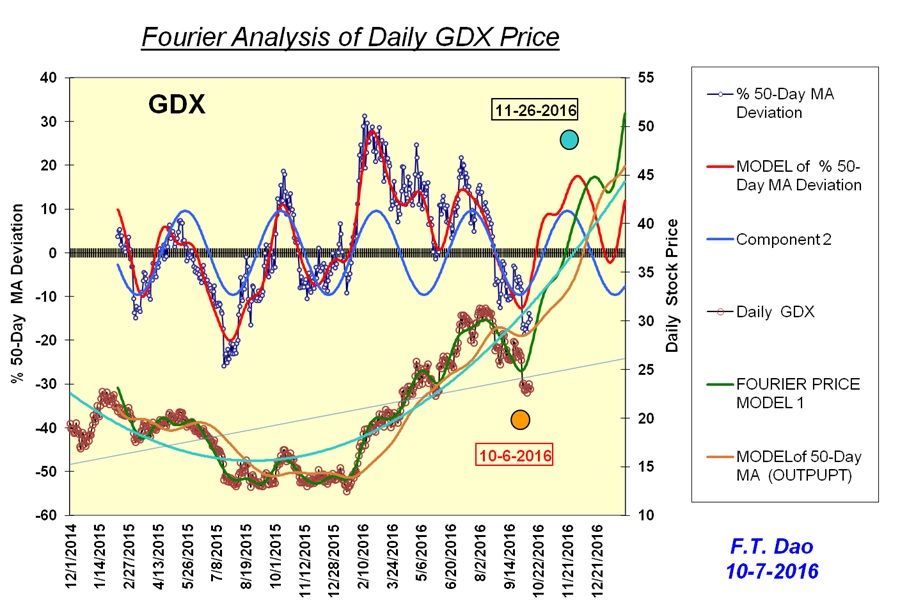
Comparing Analyses Of GDX
The following two charts compare the traditional technical analysis of the gold stock ETF (GDX) with our daily cycle analysis of the same stock. Both indicate the resumption of rise now. The Fourier cycle analysis gives more detail forecast in terms of timing and the price of the next peak.
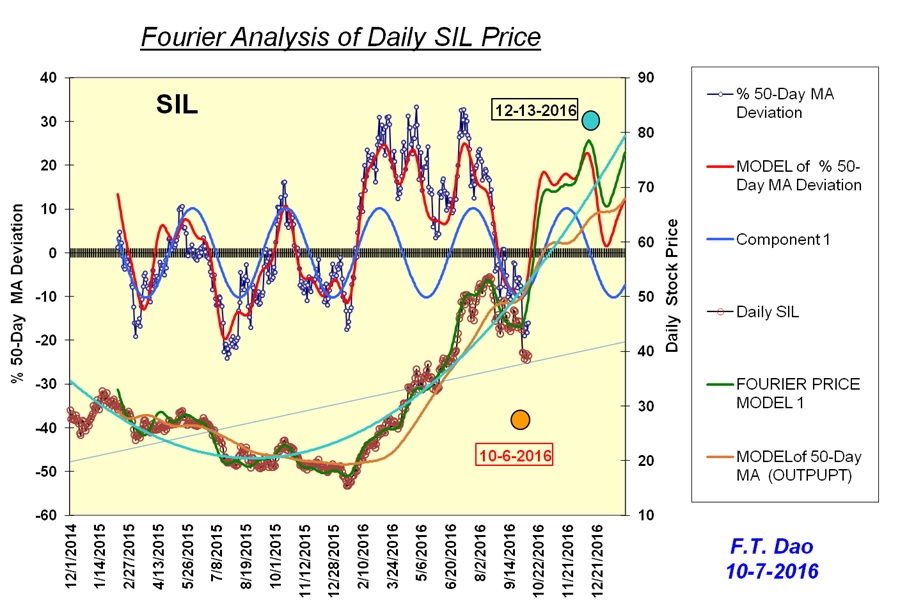
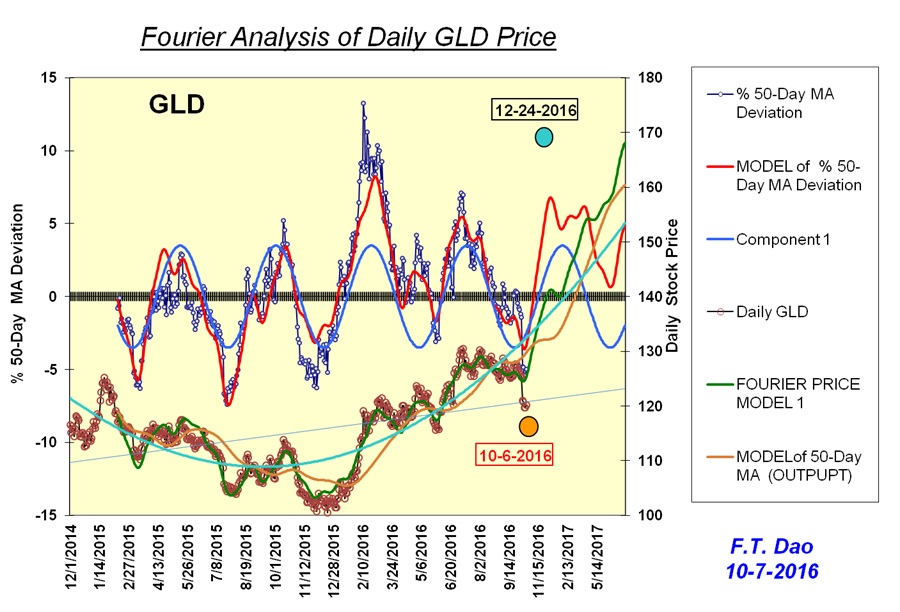
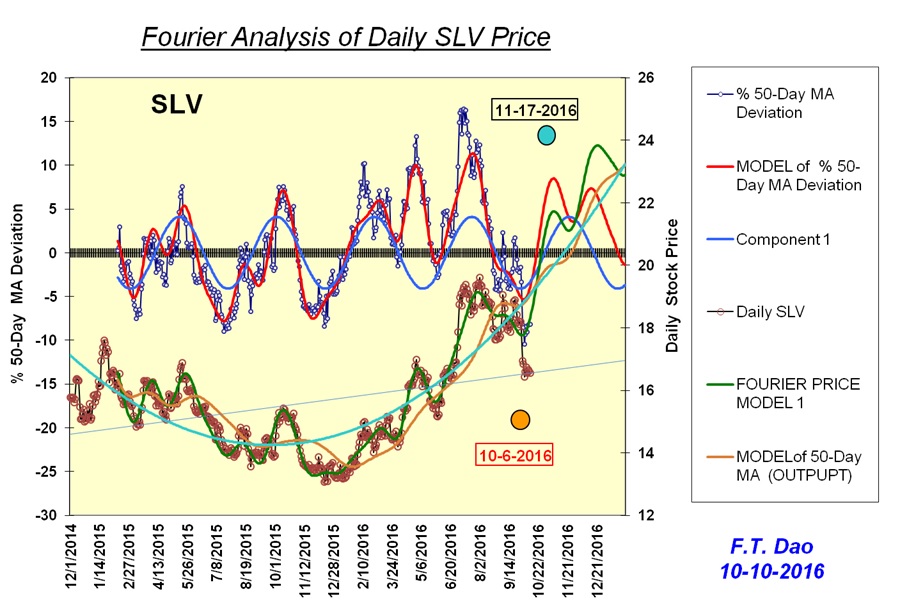
Fourier Analysis And Forecasts
This section summarizes the results of our daily stock analysis. The results table is followed by a set of analytical charts.
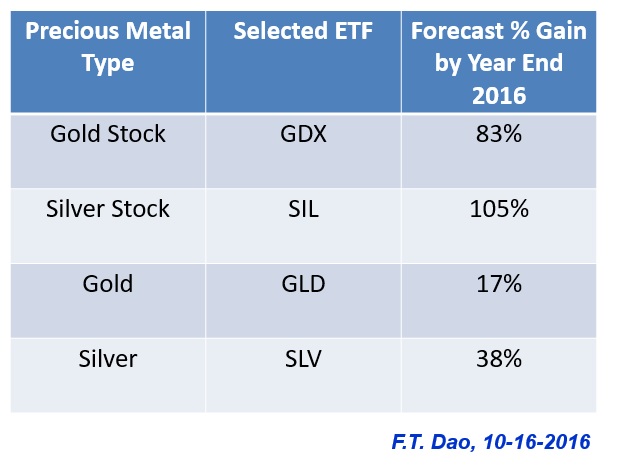
Note that the silver stocks will outperform the gold stocks. Furthermore the gold stocks will outperform the gold ETF.
The following charts also show the dominance of the 4.9 month cycle among other internal cycles.
Summary
Our analysis indicated the immediate resumption of the rise in the precious metal stocks, regardless of the manipulation or other actions. Furthermore we are reminded that the big cycle wave is on the upward side of gold and silver, as we have discussed in our earlier articles.
Finally our advice for your investments: do your own research and consult professional financial managers.


