Rising Bond Yields = Increasing Doubts in The Markets


Wednesday June 19th, the bond and stock markets had a bad day. We saw more of the same on Thursday; only worse. Doctor Bernanke testified before Congress that he was going to begin “tapering” his current Quantitative Easing’s monthly quota of “monetizing” $85 billion in US Treasury bonds and worthless mortgage. The Dow Jones on Wednesday ended the day down 208 points (-1.35%), and Thursday the Dow was down 353 points (-2.35%). The bond market had a two bad days too.
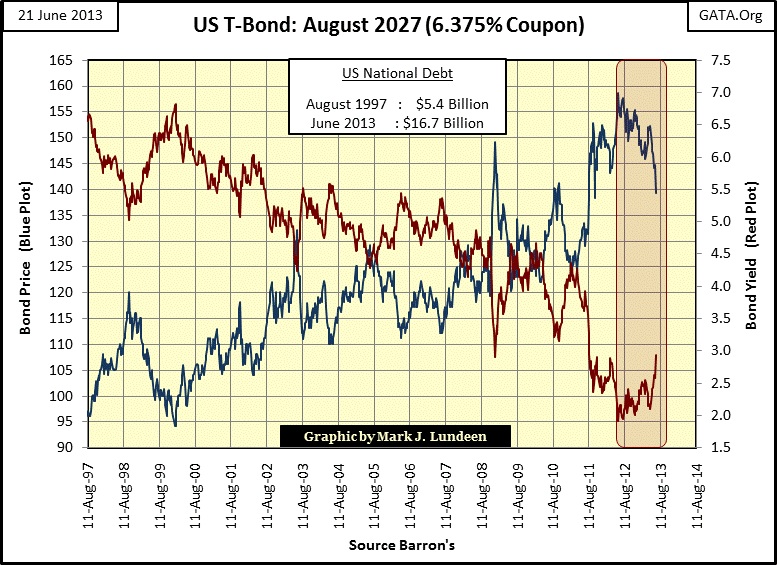
Below is a US Treasury 30 year bond issued in August 1997. It still has fourteen years before maturing. The US national debt has increased 200% since this bond was floated sixteen years ago. With the US increasing its national debt by over a trillion dollars a year, I wonder if this bond will be trading in a public market all the way to its maturity in 2027. Don’t laugh, US mortgages used to have a multi-trillion dollar secondary market that was activity traded in the global market place. But that was before 2008. After the mortgage bubble popped, the world came to understand that Wall Street converted this market into a rip-off derivative scam, and the mortgage market died for lack of bids. Today, trillions of dollars of mortgages no longer trade in a public market. For the most part, the only purchaser of US mortgages since the credit crisis has been the Federal Reserve. So it’s no wonder the Federal Reserve also includes mortgages in its QE program. Just because no one else wants them doesn’t mean that an economist can’t monetize them.
Also, since August 1997, consumer debt is up 136% and I’m sure corporate debt has increased somewhere over 100%, most likely more than consumer debt has. With the cost of debt so low, corporations have taken full advantage of the current “attractive interest rates” in the corporate bond market to finance everything but infrastructure investment. All this money (increases in debt) is just monetary inflation flowing from the Federal Reserve. But Doctor Bernanke is creating more money than the economy can use productively. That always leads to problems. Wall Street is very willing to provide access to the debt market for people, local government and corporations who currently may be able to service this debt in the current economy. But when Mr Bear returns to clean up the mess left behind by Doctor Bernanke and the Wall Street, this will not be so for many deeply indebted individual and institutions.
If you believe what the US Treasury market is telling us, bond buyers are developing buyers’ regret. Since last summer (shaded box below) the yield for this bond is up 103 basis points, increasing to 2.94% from 1.91% in the past twelve months. That doesn’t sound like much, until you realize that the market value of this bond also lost 12% in a year when the Federal Reserve was purchasing tens of billions of dollars of US T-debt in the Treasury market each month. That is a lot of buying by the Federal Reserve, but evidently not enough to keep bond yields down. If this trend continues, eventually the financial market will begin doubting the effectiveness and staying power of the Fed’s management of the debt market. In other words, a crisis of confidence will develop in the financial markets. And these days that means a market crash for stocks as well as the bond market.
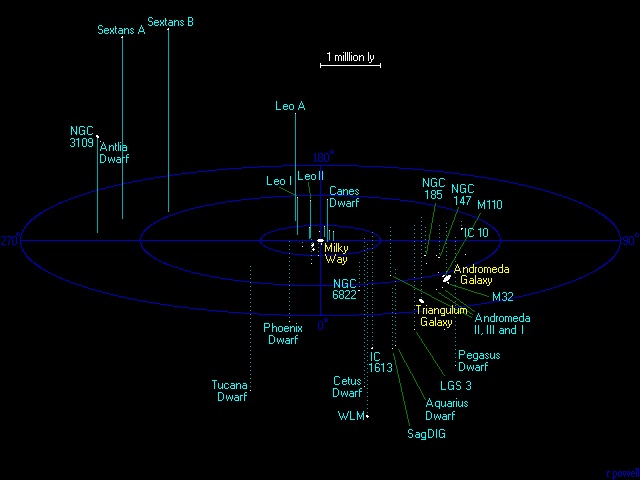
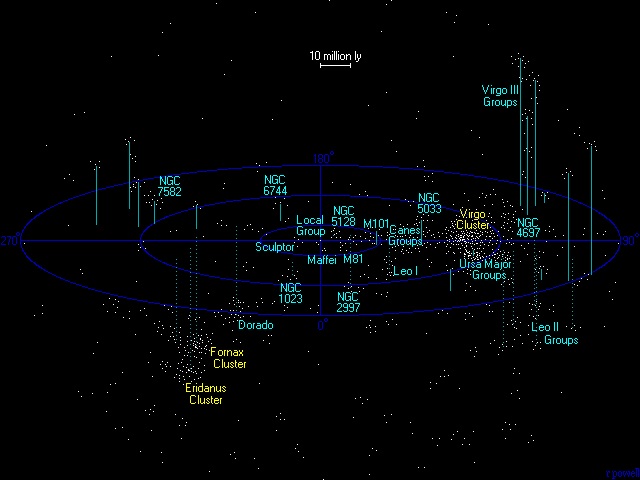
Though the market valuation of US Treasury bonds are going down, the US national debt (which in reality is what trades daily in the T- debt market) continues to increase to ever larger astronomical values. Here is a graphic of our “local group” of galaxies from Atlas of the Universe. This graphic shows what is in space within five million light years of our sun, within this volume only 700 billion stars are estimated to exist. This puts the $16,700 billion ($16.7 trillion) dollars of debt our politicians have piled-up into a comprehendible perspective; it’s absolutely huge, and growing!
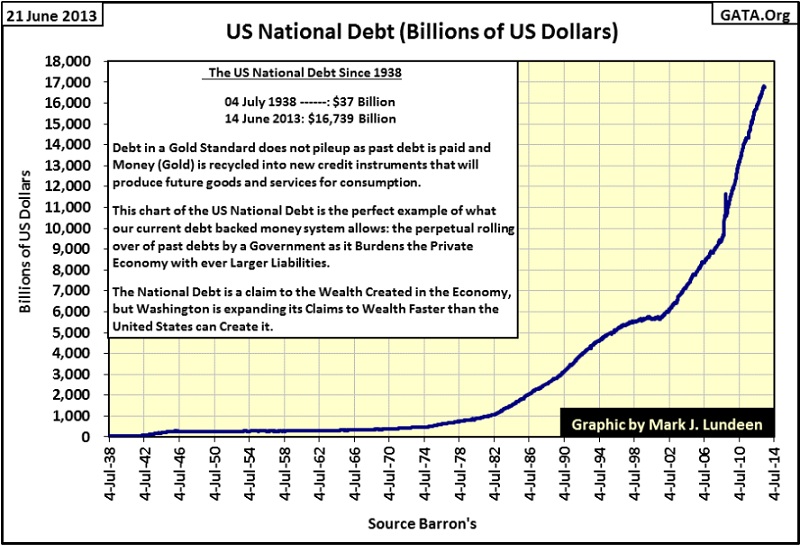
Below is a chart for the US national debt. The best way of thinking of it is, as the money spent by Washington’s entrenched political class for bribery expenditures for voters and rewards to political contributors for the past seven decades. Investing in “urban renewal” and “social engineering” as Washington does has never provided a return on the capital spent, so debts are just rolled over from one decade to the next. So far, the world has been willing to support Washington’s reckless spending. The world has even been willing to overlook little things like the fact that Washington’s financial books are never audited, as no accounting firm can make any sense of them. But if the Treasury market is coming under pressure from Mr Bear, Uncle Sam’s creditors are going to begin looking for reasons to sell their T- bonds, and there are many sound reasons for them to do so.
But then what would they to do with the proceeds from the Treasury market? Invest the funds in the Stock market? Contrary to popular belief held by many in the financial media, rising bond yields are not good for the stock market, though the stock market may benefit initially. It’s only a matter of time before wealth flees the financial markets, sending many trillions of dollars towards real assets, and that includes gold, silver and yes mining shares.
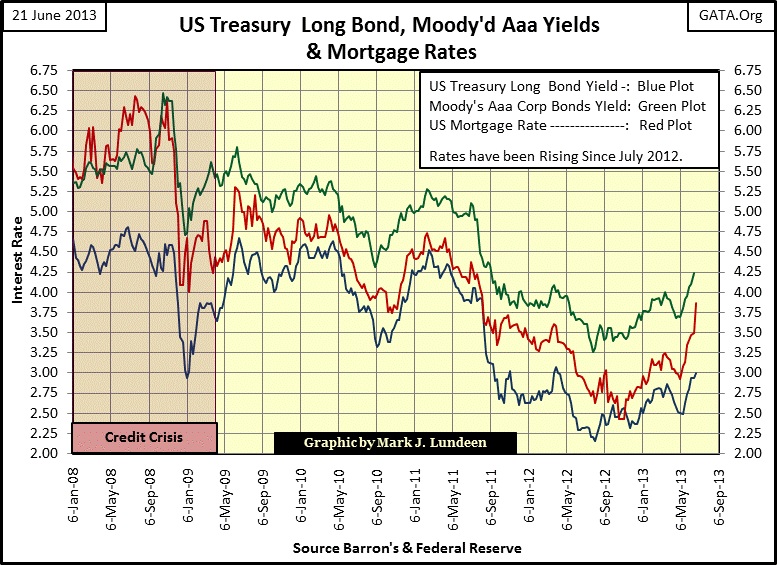
We’ll never know how much higher bond yields would have increased had Doc B. stepped aside and allowed the free market to take its course on bond yields since last June. But that didn’t happen as Doc B. feared the consequences. It’s reasonable to assume we would have seen rates and bond yields return to their January 2008 levels, or possibly higher had the debt market been allowed to find its own levels. Look at the red plot below for the US mortgage rate (Fannie Mae) published by Barron’s every week. The mortgage market finally proved itself to be a multi-trillion dollar fraud in 2007-09, but instead of seeing mortgage rates rise up to double-digit junk yields as they should have, they declined to historic lows just last summer for the simple reason that Doctor Bernanke was “monetizing” Wall Street’s toxic non-performing mortgages at full face value.
Such support of the banking system is considered normal today. “Experts” demand nothing less when it comes to fighting the hobgoblins of deflation. But this mind set is a resent invention of Alan Greenspan and Doctor Bernanke, and in no way something positive for the economy. What it actually is, is central planning and crony capitalism at its very worst. But note that in the past twelve months mortgage rates have almost doubled. I expect seeing mortgage rates to continue increasing until the 30 year mortgage is only something studied by the many Austrian economists who will someday dominate the facility of Princeton University’s economic department. There is no finer example for teaching students the horrors of mad-dog Keynesian economic policy practiced by Doctors Bernanke, Krugman and Blinder.
Most people still don’t understand what really happened during the credit crisis. Why did the political class bail out their friends on Wall Street, with the full support of academics? It was the huge hundred trillion dollar notional value OTC derivative market; it was imploding. The big banks sold “hedges” and default insurance to insurance companies and pension funds to protect their reserves. Wall Street during the mortgage boom marketed its “AAA rated mortgage products” bundled with derivatives at these institutions. When the sub-prime mortgages became worthless for reasons of abandonment by their sub-prime homeowners, Wall Street was on the hook to make good its commitments to make their clients whole. But they couldn’t as they had spent all the money they collected on fees on bonuses and salary increases for themselves.
Today the derivative market is based on another fraud; the supposed ability of central bankers to drive interest rates ever lower. If you are a bond holder, rising interest rates are something to fear as the value of the bond you own goes down as rates go up. But everyone on Wall Street knew that interest rates were only going down as Doctor Bernanke was in control, or so it seemed until last summer. So the big banks just pocketed most of the fees collected from their clients and spent it on bonuses and salary increases for themselves because rates and yields are never going to go back up. But as we see in the chart above – they were wrong. If rates continue to increase (and they will in the months and years to come) at some point the hedges and credit default swaps they sold to money managers will come into the money and their clients will demand specific performance on what Wall Street sold to them. That is when the markets become exciting again, just like they were from 2008-09 as Wall Street’s potential liabilities could run into the hundreds of trillions of dollars.
How large a risk to the financial market are these OTC derivatives? Well, the BIS keeps tabs on them, and in their derivative report’s Table 19, as of December 2012, interest rate derivatives had a notional value of $489 trillion and credit default swaps had a notional value of $25 trillion. So how big are these numbers? Going back to Atlas of the Universe here’s the Virgo Super Cluster of galaxies, which is our local group’s home in the universe. We see that the Virgo Super Group contains 200 trillion stars, less than half the notional value of credit derivatives.
Today, Wall Street’s biggest banks are extremely vulnerable to rising interest rates and bond yields, because they have behaved criminally for decades. Rising rates will cause their and our world to come down as these banks are vital components of the global payment system. So five years after the credit crisis it’s a mistake to believe the crisis is over. Not by a long shot!
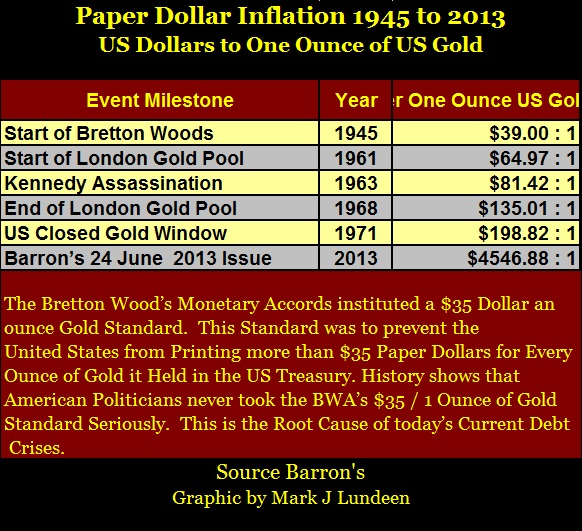
Below is a chart and table that actually frightens me a bit, the long term plots for the price of gold and the US Treasury long bond’s yield and a table for the number of paper dollars the Treasury has issued for each ounce of gold it claims to hold. Looking at the chart, from 1952 to 1970, Treasury long-bond yields rose as the US continued printing more paper dollars than their gold reserves legally allowed. By the time Nixon closed the gold window, (terminated the $35 an ounce of gold peg) the US had increased the number of paper dollars in circulation from 39 to 198 for each ounce of gold held by the US Treasury. If you define a criminal act as one that breaks a law, the US Government has been a monetary renegade for decades.
When in August 1971, the US Government could no longer maintain the Bretton Woods $35 an ounce gold peg because it had over issued the US dollar, we see both bond yields and the price of gold rise until the early 1980s.
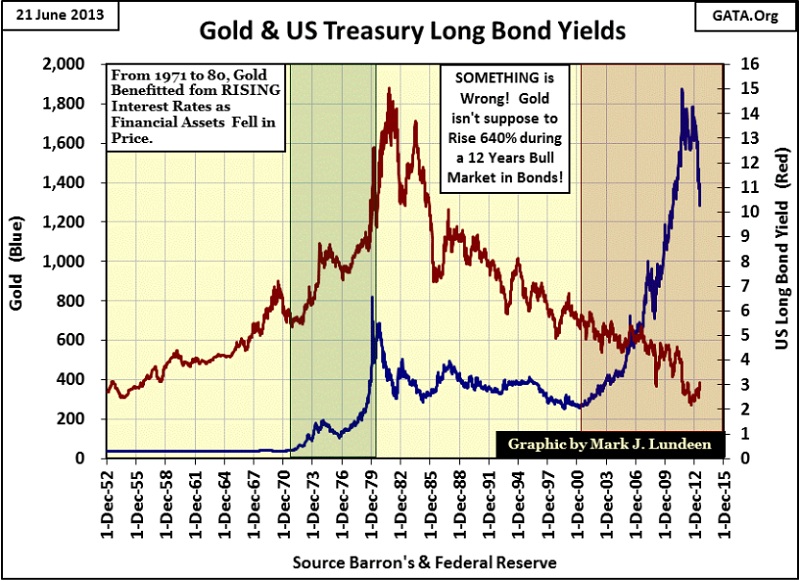
With US Long Bond yields at 15% in October 1981, the bond market found the bottom of a bear market that began in the late 1940s. Gold too topped out as it couldn’t compete with the income and capital gains bonds and stocks began delivering investors in the early 1980s. We had a two decade long reprieve during which stock and bond investors enjoyed a tremendous bull market. However in 2001, the price of gold began rising, which marked a turning point that was ignored by Alan Greenspan and now Doctor Bernanke, that financial assets were overvalued and needed to deflate. And when inflated financial assets begin deflating, gold and silver investors should become a prime beneficiary of the monetary inflation we see in the table above. In fact this actually been the case. Since 2000, gold and silver have outperformed the general stock market and bonds for the past thirteen years, even after their current corrections.
Trying with all their might, the “policy makers” are currently attempting to dictate market prices as they have done for decades. But it’s a mug’s game, as they are fighting a force of nature that will overwhelm them. Each day they grow weaker as Mr Bear grows stronger, and Mr Bear is the biggest bull on gold and silver in the world. So, interest rates and bond yield are going to continue to rise over the long term, taking stock and bond prices down as they increase. As for gold and silver, before their bull markets are over they are going to see prices that most people today believe impossible.
So how did the stock market do this week? It went down on rising bond yields. There is going to be a lot of that for the foreseeable future! I like looking at the NYSE’s 52Wk High & Low data to get a feel for market sentiment. When the bulls are happy, we see lots of new 52Wk highs, but currently we see that the dominating feature at the NYSE is an increasing number of 52Wk lows. Currently, there is no reason for panic in the stock market, which sounds like a good reason to begin to reducing one’s exposure to the stock market. If you have some money in the market, locking in some profits is never a bad thing after a nice run up in the market, which has been the case since the first week of January of this year.

Let’s face facts; financial assets are only going up because Doctor Bernanke was making them go up with targeted monetary inflation, and in the past two weeks he has made it clear that he is having second thoughts on continuing his QE program. Now I doubt he will do anything but increase his rate of monetization of bonds and junk mortgages, as he fears a market crash if he does. But with current financial assets’ valuations only being a function of the confidence the markets have in the idiot savants managing the Federal Reserve and other central banks, growing doubt isn’t a good factor for the bulls.
The Dow Jones ended the week down by 3.96% from its last all-time high of May 28th. During a bull market, this isn’t anything to be concerned about, nor would a repeat of the 16% decline as we see happen in 2011 be a concern, except that interest rates are now going up. That changes everything as far as I’m concerned.

But as I’ve shown frequently in the past few years, trading volume is declining as valuations appreciate. Since the 2000 high-tech top, the one hundred year pattern between valuations and volume trends had been reversed. Look at the 2002 and 2009 bottoms; both occurred on spikes in trading volume. That isn’t how things used to work. Heck, in July 1932, at the 89% bottom of the Great Depression bear market, there were more tumble weeks on the floor of the NYSE than buyers.
Rising trading volume on falling prices was also true for the August-September 2011 decline. You can’t miss this bottom in the Dow Jones in the chart below, as trading volume saw a spike on it. These bizarre spikes in demand for stocks are from Doctor Bernanke, who in one way or another, has made it a regular habit of buying things on Wall Street that everyone else wants to sell.

It’s really strange seeing the current Dow Jones for the past year going on to new all-time highs on low trading volume. This just isn’t natural. But if the Dow Jones is going into a rough patch in the months to come, expect seeing its volume once again spiking upwards as Doctor Bernanke comes to the rescue. But this too shall pass.
Mark J. Lundeen


