Sellers Of Gold And Silver Remain In Control


 This week, we are ending our commentary portion, probably until January due to a pressing time commitment for the next several weeks. Starting from next week, we will post charts and chart comments only on this site. If you are not a subscriber and still want to read the chart comments, you will have to subscribe in order to follow the updates.
This is not an effort to increase subscribers, rather, it is the only viable way because the sites to which our articles are submitted prefer some accompanying commentary, in addition to the charts. We do not use subscriber e-mails for any purpose other than submitting our commentaries directly to them. Subscriber privacy is respected. Besides, from our point of view, the charts tell the most compelling story.
Charts…
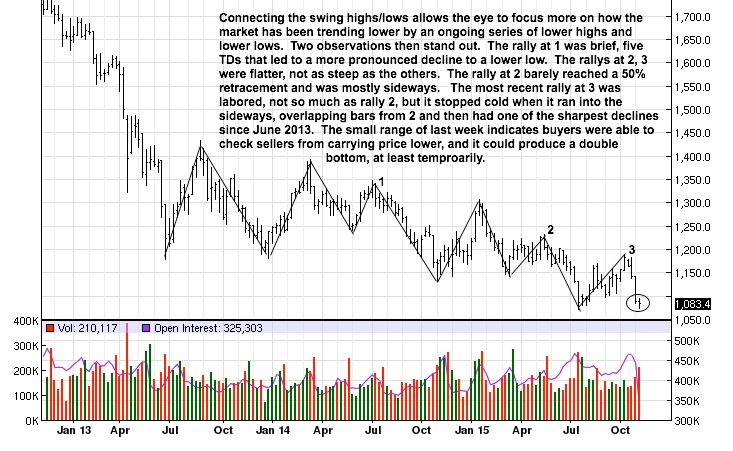
The continuing PM down trend is obvious, but sometimes adding a simple line to connect the swing highs and lows can alter what the eye sees. As a consequence, we were able to focus on reaction rallies 1, 2, and 3 for a comparison and assessment, as explained on the chart.
Typically, when a trend ends, there is often some form of dramatic price/volume activity that stands out. An example would be seen in the activity on the left portion of the chart. Price declined sharply into the June lows and had the look of a potential end to the trend. What is missing and explains why this was not an end to the down trend were two factors: lack of heavy volume at/near the lows, your typical sign of change from weak hands into strong hands, and the initial reaction rally off of the low was not that strong.
What you are seeing in gold is a steady decline with no apparent panicking to form the basis for a bottom. The very small range of last week is the antithesis of a panic. It shows that buyers were keeping sellers in check after a sharp decline. Sellers lost control, at least for the week. This opens the door for buyers to begin a reaction rally, and that remains to be seen.
The strong rally bar from 3 weeks ago was a sufficient performance for us to take a small position from the long side, one that lasted less than a day. The gap lower opening proved the strong rally was a bull trap, and it was also evidence of how weak the gold market is, was at that time. The subsequent 11 day decline demonstrated gold’s continuing weakness and seller control.
The small loss suffered was a no-brainer decision because there was a stop in place at the same time the buy recommendation was initiated. This removes any/all reaction surprise and/or guesswork to the reaction opening lower. Those who choose not to use stops were then confronted with holding for a reaction higher, that never developed, or not knowing how to handle the trade that unexpectedly moved sharply lower. The net effect is almost always a greater loss than if a stop were already in place. A word to the wise…
Will this potential double bottom hold? After the wide range bar decline, 6 bars ago, the last 5 bars have been overlapping, and the closes are almost clustering, both signs for a possible change in price direction. A rally can be expected, but surrounding circumstances dictate it may not last, as explained next.
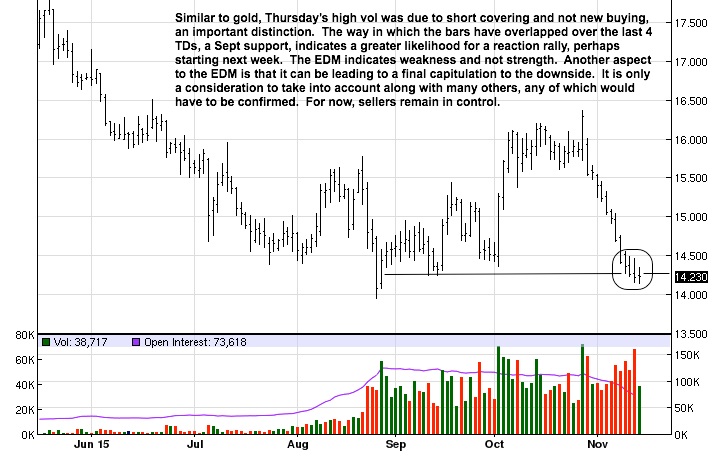
The circled high volume reflects short covering at a previous low. It can lead to a “double bottom,” but not one that would be of last duration due to the precipitous decline leading up to the low of Thursday. A reaction rally, yes. A sustainable rally? Not likely, for two reasons. First, the sharpness of the decline, as mentioned, and second, the trend is still down and controlling. Both weigh against the odds of a reversible rally with staying power. [EDM = Ease of Downward Movement]

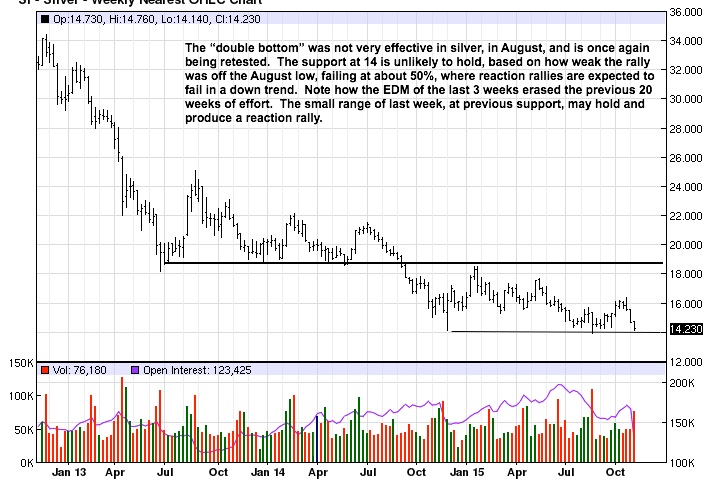
We often mention how one move needs to be confirmed by the next, yet to happen, ensuing move. Too many traders do not exercise enough patience to wait for some evidence to confirm what already took place. The “double bottom” in silver was not confirmed by subsequent activity. In fact, the weak rally reaction and inability to exceed a 50% retracement from the last swing high were both signs that the rally was not likely to hold. As in gold, last week’s small range can lead to another reaction rally. The character of the next rally will be more clearly seen on the daily chart.
The bull trap was much more apparent in silver, [the failed high rally at the end of October]. Here again, if one did not use a stop in going long, an amateur’s tactic, one would have more than likely suffered an unnecessary larger loss, and they add up.
The increased volume on that failed rally was a false sign of strength. It was actually an exhaustion rally destined to fail, but that could not be known until it was confirmed the next TD. Not every buy or sell position or signal will work successfully, and that is a part of doing business, and it is also acceptable and to be expected. This is why stops are so essential in trading. [TD = Trading Day]
The signs leading to what may be another temporary bottom were negative, just as in gold: very sharp drop and the trend being down. A reaction rally can be expected, even next week. What will be critical to watch is how the rally develops because the probability is that the reaction rally will be temporary, even if price rallies back to the 15.50 – 15.70 area, an optimistic target.
The decline in Precious Metals does not appear to be over.
********
Courtesy of edgetraderplus.com


