Silver – The Golden Metal


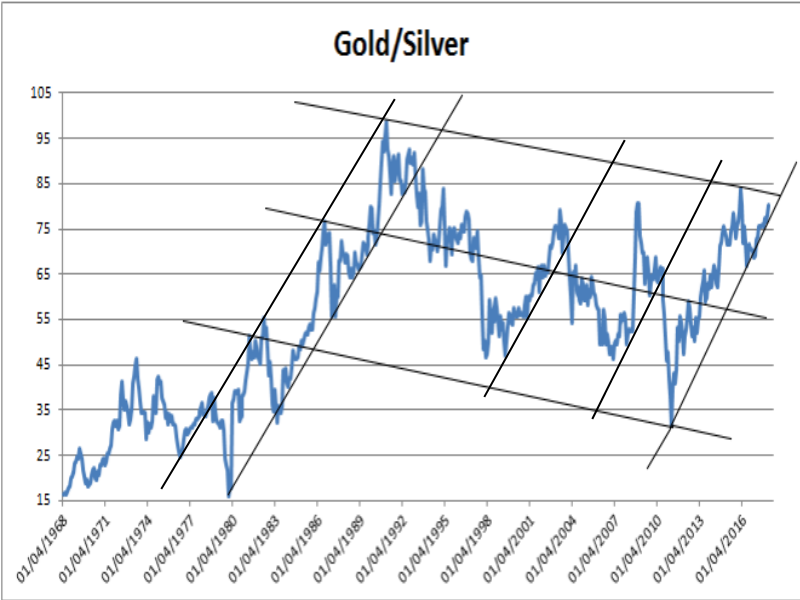
Recently, the gold/silver ratio broke and held above the 80 level for the first time since before 2000 and is now hovering at that level again. This have attracted much attention from commentators, at least one of whom saw it as a distinct opportunity for investors to “…sell gold and buy silver!” – advice that at first thought makes strange sense for PM bulls. Gold has been the focus for such a long time, with silver holding sideways around $5/0z – except for the Hunt brothers episode – until deep into 2010. In August the gold price caught fire while silver lagged, for the ratio to reach a spike top at 48.70 to record a gain of more than 2720% within 8 months.
Monthly Ratio of Gold/Silver (FRED)
The long term and ancient ratio with gold about 15-16 times more expensive than silver, similar to the prevalence of the metals in the earth’s crust, held mostly true during the late 1979/80 bull markets in both metals, when the Hunt brothers tried to capture the silver market. However, the silver price collapsed as Comex pulled the rug from under the Hunts and that the ratio was whipsawed as the price of gold fluctuated wildly while silver held mostly sideways below $5/oz, until late in 2008.
The ratio hit a high of 98.6 in February 1991. After a deep and volatile correction, it again broke above 80 in 2008 and also more recently in 2016, closing last month at 80.16, barely above that level. Of significant technical interest must be the fact that whenever the price of gold outperforms that of silver, the increase in the ratio fits the same steep gradient that has been in place since the 1970s through to today.
There appears to be a slightly bearish channel that also fits the chart back to the early 1980s, which might offer the current rising trend top resistance a little below the 85 level. This is a chart of the monthly close and we might have to wait until the end of March, or even later, perhaps to June or July, to see if that resistance comes into play. The most recent break below a steeply rising support line of the ratio happened at a ratio of about 65 mid 2010 and spiked lower to a low of 31 in April 2011, more than halving the ratio in well less than a year.
It is evident from a glance at the chart that when the ratio improves in favour of the price of silver, it tends to happen as a steep trend, spiking lower. This provides evidence for the view that once suppression of the prices of gold and silver ends, it will be the jump in the price of silver that again outperforms that of gold. This view – supported by the technical historical evidence shown in the chart – is reflected in the title of this report where the traditional use of ‘golden’ with a meaning as being ‘the best of all’ is used in a punning way to focus attention on silver!
Wall Street is continuing its sideways and very volatile shuffle and it is certain that many long suffering equity bears are looking at this as the final shivers and shakes of the Bull that had started in March of 2009 when the Federal Reserve distributed a vast number of Benjamin Franklins to keep the financial system afloat. Having only bonds to compete with for a home for these funds, Wall Street started on its bull market that has now lasted practically unbroken for 9 years. If this does prove to be the Bull’s death rattle, look out below. A vast increase in both passive EFT’s and the margin used to chase the bull higher could easily trigger a full panic. Long term bears probably have exhausted their funds by now and are not around to take profit, so that a panic could develop into a free fall – with a bearish bond market not able to act as the traditional safe haven.
The slide in the value of the dollar for much of last year turned sideways in mid January and is still holding within a narrow range. Last week ended with the euro having just failed to hold a recent break above resistance. This implies its sideways trend is likely to continue, with the euro holding just above key long term support.
Last week Friday also saw the monthly NFP announcement and the record number of new jobs saw Wall Street setting off to a new recent high and helped the DJIA to more than recover from the shock of the tariff hikes earlier the week. Now that this date for a regular mauling of the metal prices is behind us, March may well see gold and silver prices improve again. Perhaps, with silver held under a close ceiling, with the SGE premium as high as $1.45, we could see the G/S ratio hit the resistance at the top of the sideways channel on the above chart.
Euro-Dollar
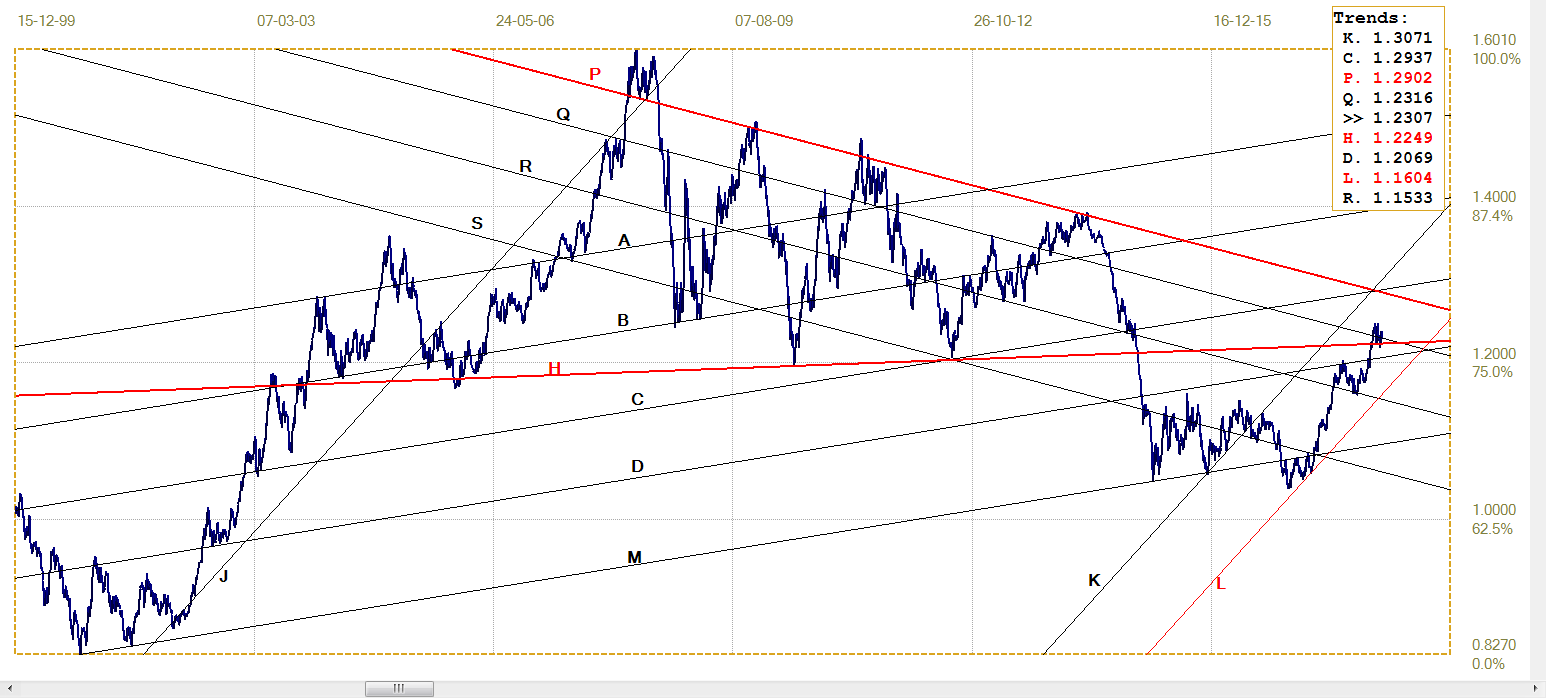
Euro-dollar, last = $1.2307 ( www.investing.com)
As mentioned earlier, the dollar has turned sideways and the euro is moving up and down in a tight range holding just above support from line H ($1.2249) and around line Q ($1.2316). The initial break above line Q failed to hold and there was a brief break below line H as well. The rising trend in channel KL ($1.1604) is still intact; support at line D ($1.2063) also comes into play before the bull channel can be tested.
Triangle HP is not the normal 5-leg pattern with a break at or shortly after the end of the fifth leg. The euro broke steeply lower at the end of leg 6 and after hovering around the bottom of shallow bull channel AM for a while started off on the current rally that has now managed to break back above line H. This should be bullish for the medium to longer term should the support at line H manage to hold.
DJIA
The high volatility continues, frequent intra-day gains of 300+ and steep losses that not always last until the end of a trading day. On Friday, the DJIA has again closed below the steep support of line L (25 004) as a sign of weakness. However given all the evidence of sustained support when the DJIA does slip lower, the bear have to be careful of falling into a bear trap. Tensions in the economy are increasing, but in the recent past such problems had hardly any bearish effect on Wall Street.
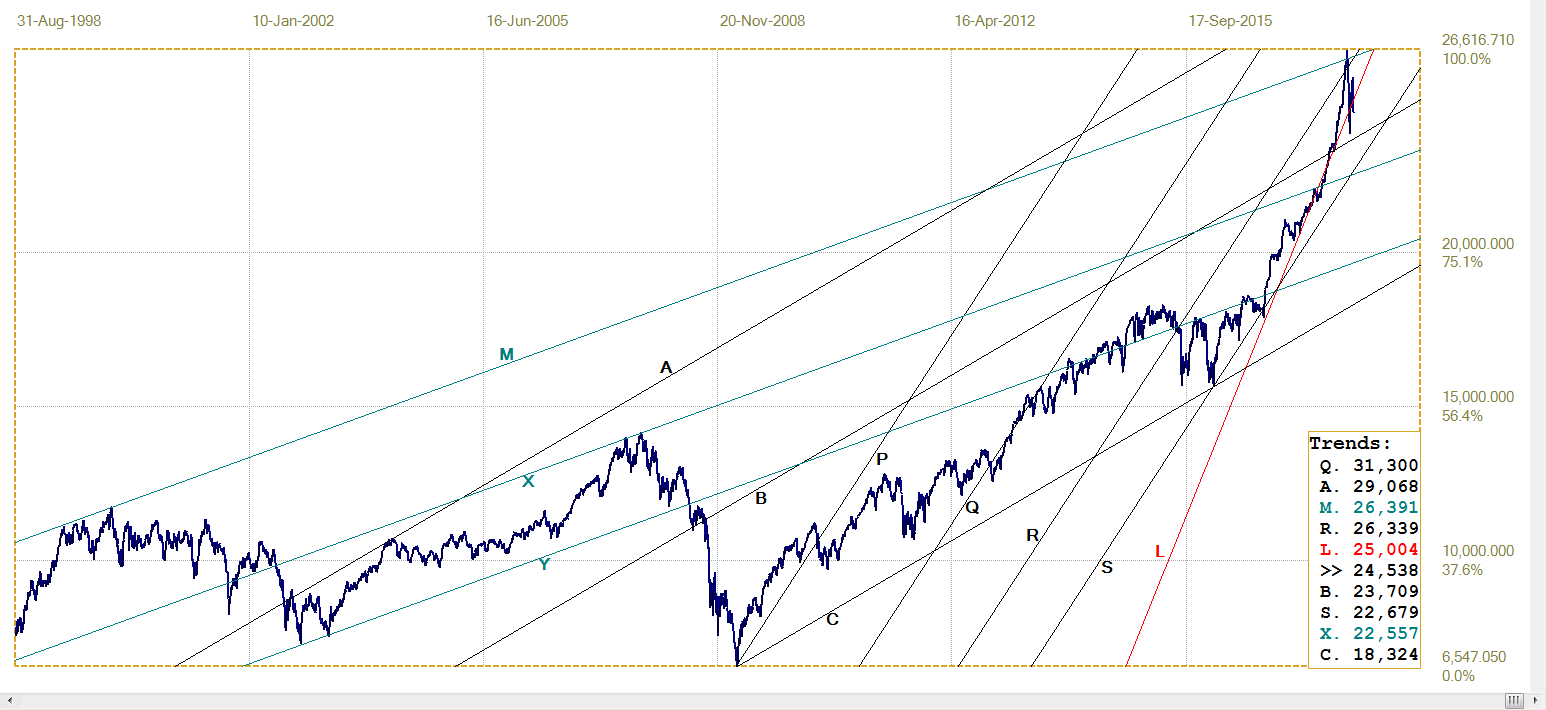
DJIA, last = 24538.06 (money.cnn.com)
Gold PM Fix - Dollars
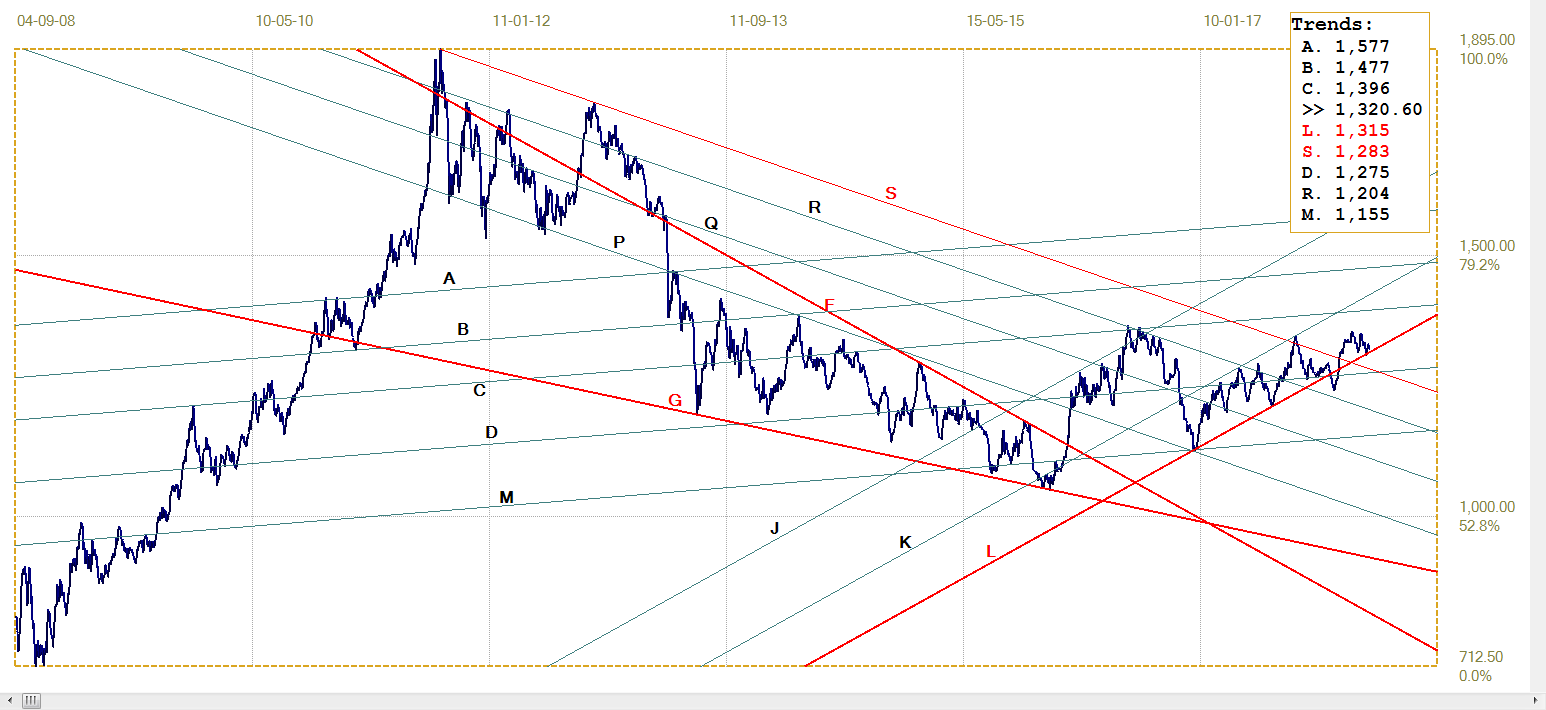
Gold Price – London PM Fix, Last = $1320.60 ( www.kitco.com )
The rally that had started after a recent break below support of channel KL ($1315) to also recover above resistance at line D ($1275) and with a new break above the wedge formation GS ($1283) has so far managed to hold to the support of line L despite the fierce suppression of the past month or so. The usual selling associated with the NFP announcement last Friday has failed to set a new recent low, holding just above $1320.
The outlook remains bullish while this support holds, but the future for gold will look brighter if the price can set a new recovery high above the two recent tops. To do so would require a PM fix above $1346 and then also a break above line C ($1396) to clear the way higher.
Euro-Gold PM Fix
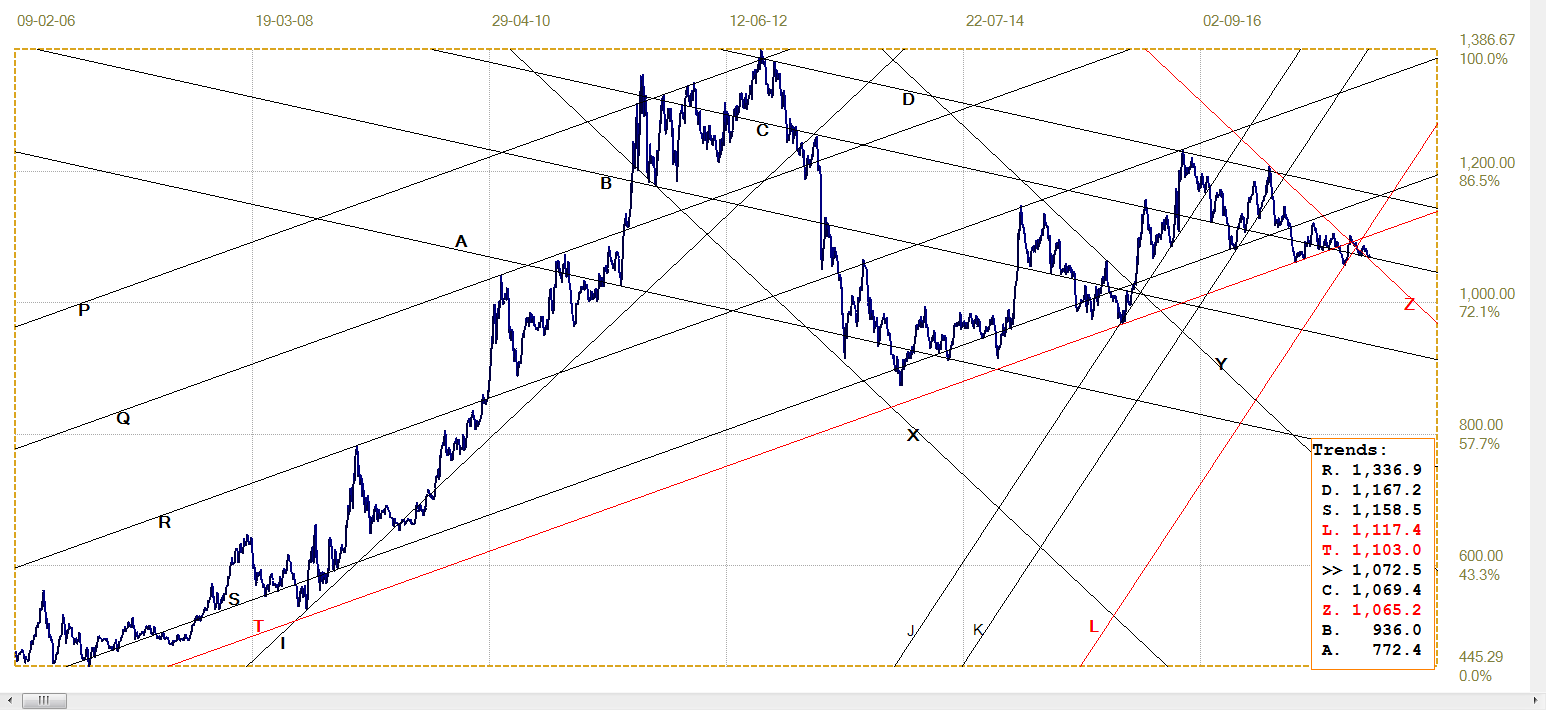
Euro Gold Price – PM Fix In Euro, Last = €1072.5 ( www.kitco.com)
The recent break above steep bear channel YZ (€1065) was a technical signal that the euro price of gold was ready to advance, but this did not materialise. It seems the break below bull channel KL (€1117) has priority and it required support from line C (€(1069) to come to the rescue. That support is still holding, but with the possibility that the dollar could resumes its weaker trend. a stronger euro would place the euro price of gold under pressure – unless the dollar price of gold now improves substantially after the recent series of severe attacks.
A recovery – if that should happen – has to return to bull channel ST (€1103) to confirm that gold in euro is again in a clear rising trend.
Silver Daily London Fix
Silver Daily London Fix, Last = $16.485 ( www.kitco.com)
Last week the gap between the price of silver metal in Shanghai and its futures price on Comex and the LBMA in London, opened to $1.45, the most I have seen for a long time, if not the most ever. Since then it has closed to $1.29, which is still on the high side.
The price has remained without direction and has to recover to break back above line L ($17.67) to technically resume the earlier bull trend, but can rally at a lower gradient by remaining below line L, but following it higher. For the time being while pressure on the price remains severe, this is not likely to happen.
U.S. 10-Year Treasury Note
Following the recent and very brief steep rally in the bond market, which took the yield on the 10-year note below lines L (2.935%) and R (2.855%), the yield soon bounced back, but only for a recovery back above line R. Line L is too steep and has moved out of easy reach.
The good labour statistics is reported to make four rate hikes in 2015 a very good possibility and is likely to push the yield higher. Should Wall Street also come under pressure – to make the usual switch between bonds and equities impractical – the possibility of a panic as investors try to escape from the Bear is very real.
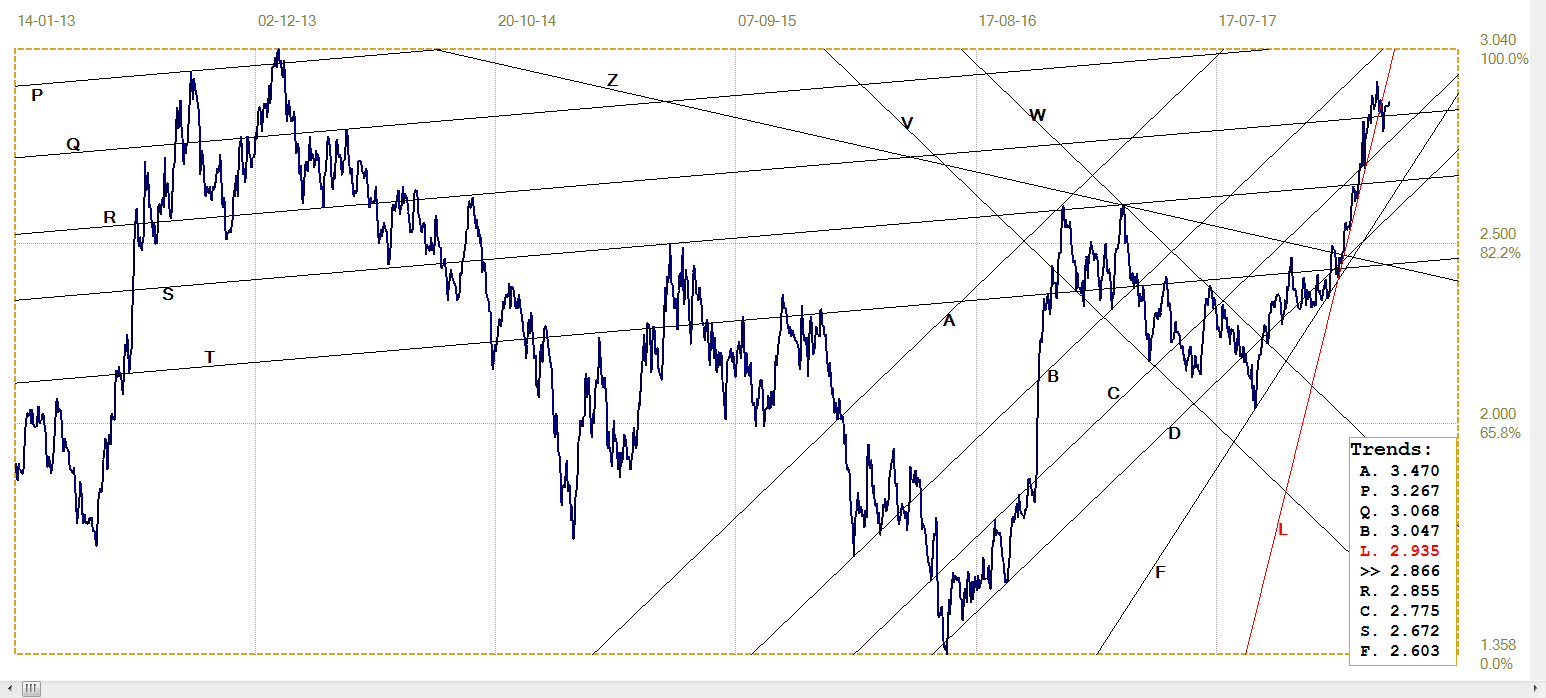
U.S. 10-Year Treasury Note, Last = 2.866% (www.investing.com )
West Texas Intermediate Crude. Daily Close
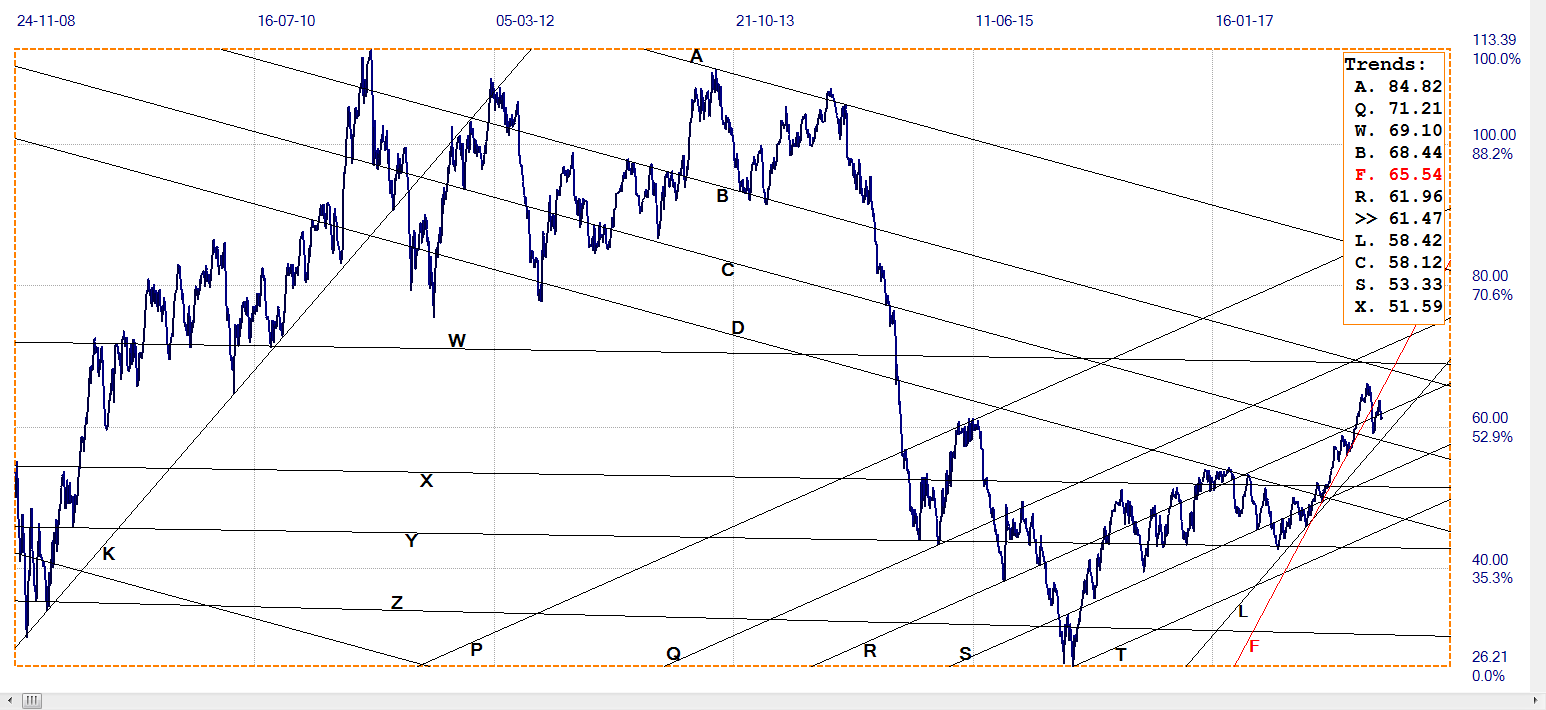
WTI Crude – Daily Close, Last = $61.47 ( www.investing.com )
The recent rally in the price of crude topped out and the price broke lower to sink below the steep support of line F ($64.54) and also the support of line R ($61.96) – only to fail to hold the subsequent recovery back above line R. New weakness has set a bearish tone with the marginal break back below line R. The medium term bull trend is nevertheless intact as long as the broad bull channel KL ($58.42) holds.
********


