Gold, Silver, & Gold Stocks Since 2011 - Gold Kills It!
 share
share
 share
share
 share
share
 share
share
 share
share
 As anticipation builds regarding possible outsized performance for silver and gold stocks, it might be worthwhile to review past performance for the two upstarts versus their mentor and perennial favorite, gold.
The chart below shows monthly closing prices for gold, silver, and gold stocks since their respective price peaks in August 2011. The prices are "normalized" to illustrate percentage changes and direction. All three items are indexed to a starting value of 100. The respective origin prices are $1825/Gold, $41.76/ Silver, 601/Gold Stocks-HUI; closing prices as of May 30, 2025 are $3288/Gold, $32.95/Silver, 398/Gold Stocks-HUI...
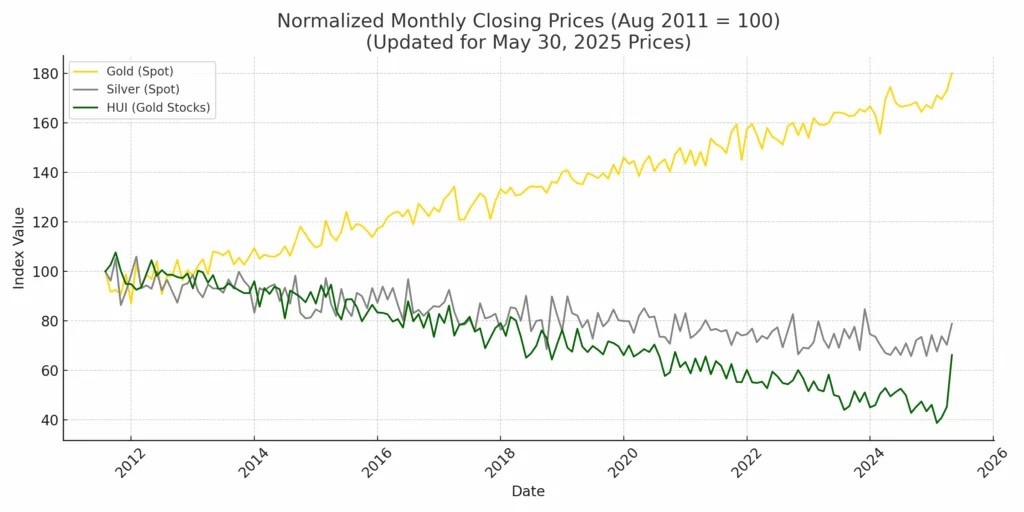
The disparity in performance could not be more obvious. The price of gold has increased by 80% from $1825 oz. to $3288 oz. while the prices for silver and gold stocks have declined in both relative and absolute terms.
As of May 30, 2025, the silver price is 20% lower than it was fourteen years ago. Compared to gold, silver's price performance is -55%. That means the silver price would need to more than double (to $75 oz.) just to match the current gold price increase since 2011.
As for gold stocks, the news is worse. The HUI declined by 33% for the same fourteen-year period. Compared to gold, the price performance for gold stocks -63%.
RECENT PERFORMANCE NOTWITHSTANDING
Both gold stocks and silver have shown measurable strength relative to gold itself as of late. That could continue temporarily, however, longer-term historical data indicates that short-term periods of outperformance by silver and gold stocks are followed by much longer periods of underperformance.
For example, below is a long-term historical chart that reflects the ratio of HUI (gold stocks index) to gold...
HUI to Gold Ratio 1996-2025
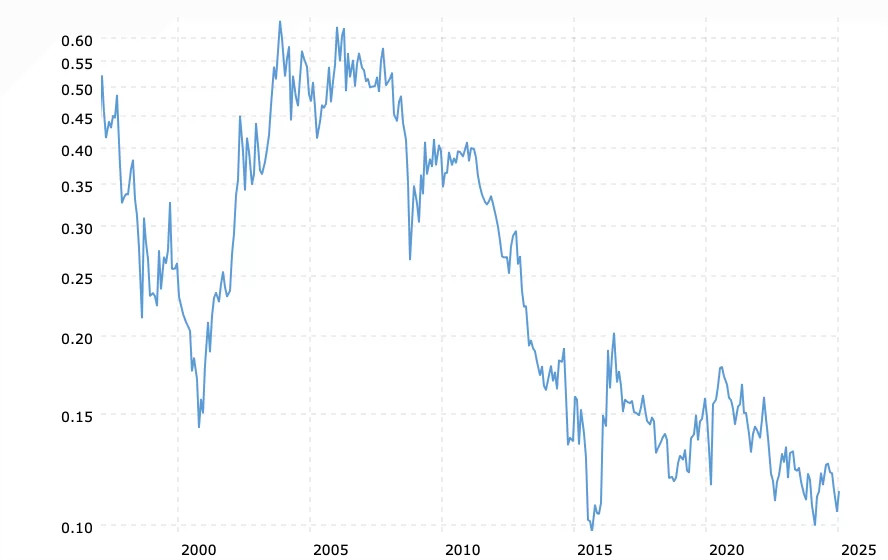
After peaking above .60 in 2004, the HUI-to-Gold ratio dropped to point .10 by 2015 - a short 3-year period of outperformance for gold stocks was followed by a much longer period of eleven years during which gold stocks failed to match gold price increases on the upside and declined considerably more than the yellow metal on the downside. After a short reaction period of one year, the long-term underperformance returned quickly and continues today.
In addition to a history of underperformance compared to gold, both gold stocks and silver have declined in absolute terms since 1980. For example, the silver price peaked at close to $49 oz. in January 1980. Forty-five years later, the current price of silver is $36 oz. - a loss of 26%.
CONCLUSION
Regardless of recent short-term outperformance, gold stocks and silver are poor alternative choices for gold itself.
Since 1980, both gold stocks and silver have been net losers while the price of gold has increased four-fold, from $843 to more than $3300.
There is no evidence to support expectations for lasting outperformance of gold stocks or silver compared to gold.
Buy physical gold. (also see Gold Stocks - Fantasy vs Reality)
Kelsey Williams is the author of two books: INFLATION, WHAT IT IS, WHAT IT ISN'T, AND WHO'S RESPONSIBLE FOR IT and ALL HAIL THE FED
********
share
share
share
share
share


