A Simple Yet Effective Way to Trade Gold
The truth is most traders lose money. And the few that do make money seem to make tones! Why is that? Let's take a closer look to what the average Joe see's and does.
Average Joe Chart #1

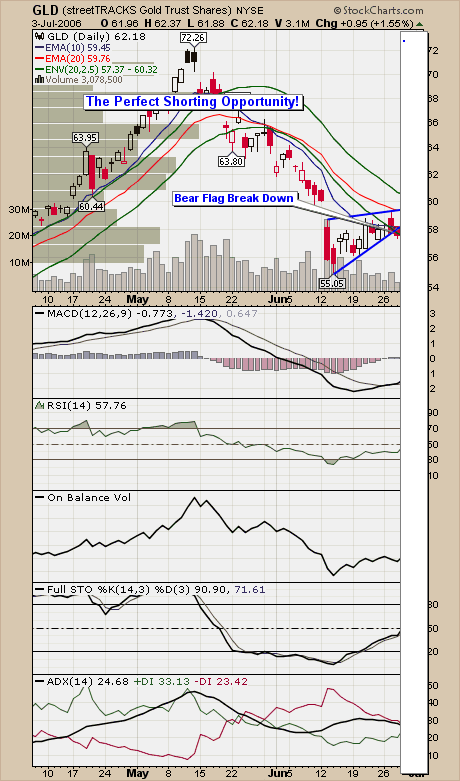
This chart shows the type of trader who trades just patterns trying on capitalize on the breakouts. It looks and sounds easy but this style of trading is not consistent or accurate and that's why they lose money. This trader would look at this chart and say to himself "what a perfect short setup!"
Average Joe Chart #2

This is what another type of average Joe looks at to trade. As you can see this person is in love with indicators I know a lot of traders who use even more indicators but I didn't want a chart that was two miles tall.
Even though this trader has many indicators it does not add much advantage to trading. The MA's are saying it's in a down trend while the MACD is saying neutral to up. Both the OBV and ADX are in no man's land. But your trend lines are showing a bear flag break down. Volume is tapering off as the price moves higher which are negative as well. So the majority of the indicators are negative, so this trader holds his breath and goes short.
Average Joe Chart #3

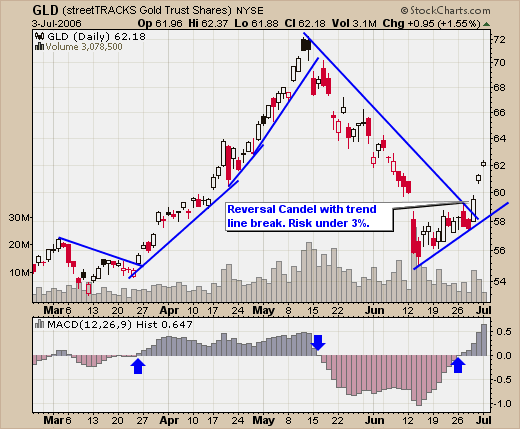
Average Joe takes another beating from what looked to be a perfect setup. This type of trading will not make you wealthy by any means.
The Simple Yet Effective Trading Model
This trading model can be used to trade most sectors but gold is the best. Below you will see a quick glance at how we see the gold sector. Managing risk is something we take seriously. We will not enter any trades with a risk of more than 3%. Our consistently winning trading model keeps us on the right side of the market and we are never on the wrong side for log.
Gold Sector Analysis - Monthly Trend

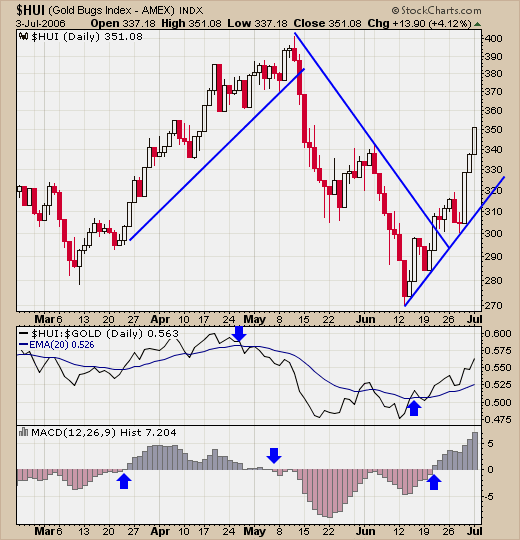
The HUI monthly chart managed to recover from the past few weeks of selling. This spike low provides us with a new point for our support line to be drawn. This flatter trend line will allow breathing space for the market to correct. The long term trend is UP.
Gold Sector Analysis - Daily Trend

The daily chart of the HUI has made a higher high and is out performing the price of Gold. This is a bullish sign for gold and gold stocks. The HUI is on a buy signal which is needed before we look to enter any of our gold stocks and funds. What generates our index buy signal are the following:
- A trend line break of resistance
- The HUI to out perform the price of Gold
- A MACD cross over
- Two points to create a support trend line.
Once these are established a Gold sector buy signal is generated and we start looking for an entry point with our stocks and funds.
Trading Vehicle & Signals - GLD
GLD - Street TRACKS Gold Trust Shares ETF

We had a buy signal for GLD on Thursdays close at $59.50 and we are now long. We must have a MACD cross over in the stock or fund before we go take a position. This helps avoid whipsaws and entering false setups like the average Joe. We remain long until we have a trend line break down.
Summary
By using inter-market analysis and having a game plan trading can be simple and effective. Our trading model does not find bottoms or tops, but sometimes its does surprise me how close it can be. Our key focus is risk management and to capitalize on the body of the price movement.
We are currently in a corrective phase due to the fact that current prices are below the recent highs of Gold and the HUI index. During a corrective phase, bounces tend to be small and generally become smaller each time until a new breakout to the up side or down side occurs. Also there is a higher chance of whipsaws in the market; therefore we only trade ETF's during correction phases.
July 4, 2006
Chris Vermeulen - www.TradersCorporation.com


