Stock Market/GDX New Lows Coming: Panic Ahead?


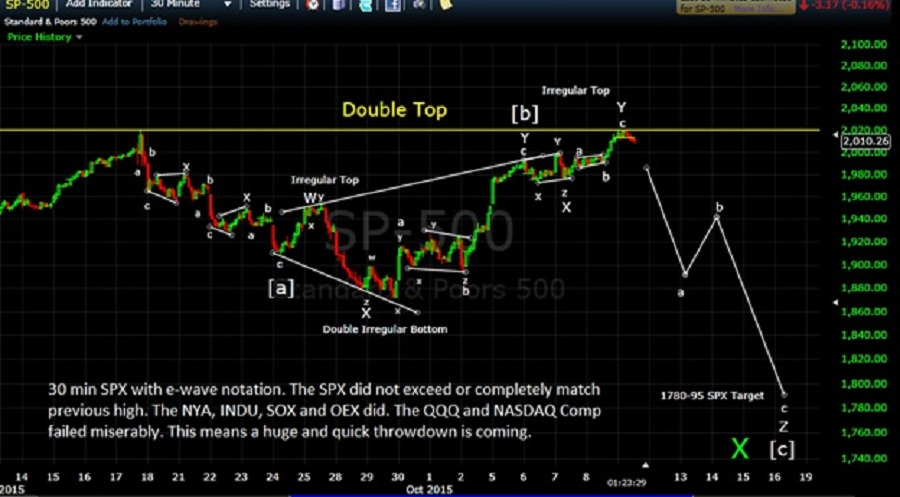
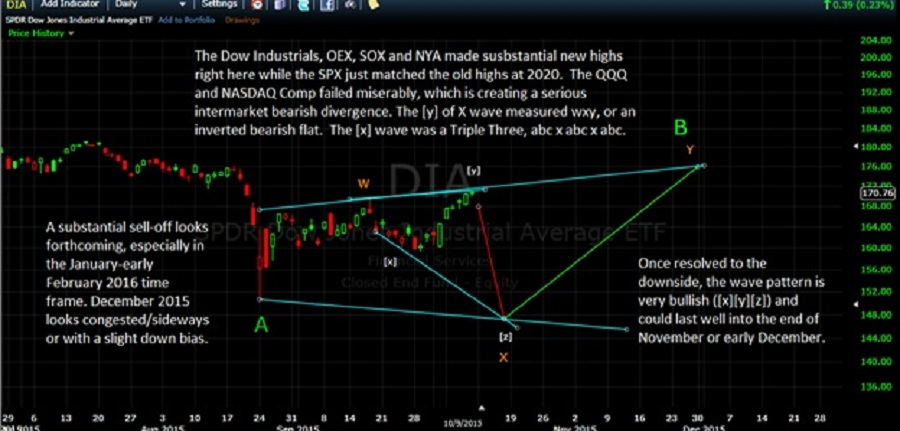
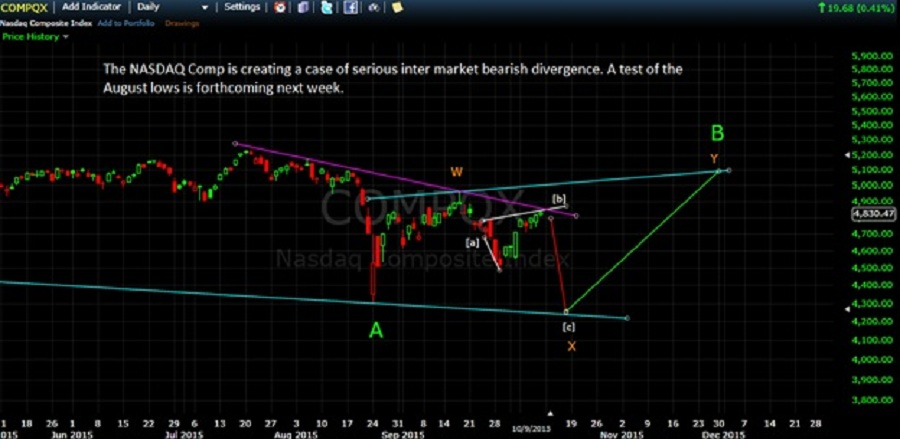
 The stock market came back with a vengeance out of the late September low (5- week lows), but failed to come back evenly, creating a case of an inter-market bearish divergence. The Dow Industrials, NYA, OEX and SOX made a higher high above the September 17th top on October 9th, but the SPX and NASDAQ Comp failed to do so. The SPX came close but the Comp failed miserably. In charting terms, we have just created a “double top” and hence a ‘double top reversal’ is at hand. Normally, it runs a Fibonacci .333 to .382 past the previous low (1871 SPX) and that forecasts ideally somewhere between or near 1780-96 on the SPX within the next 5-6 TD’s.
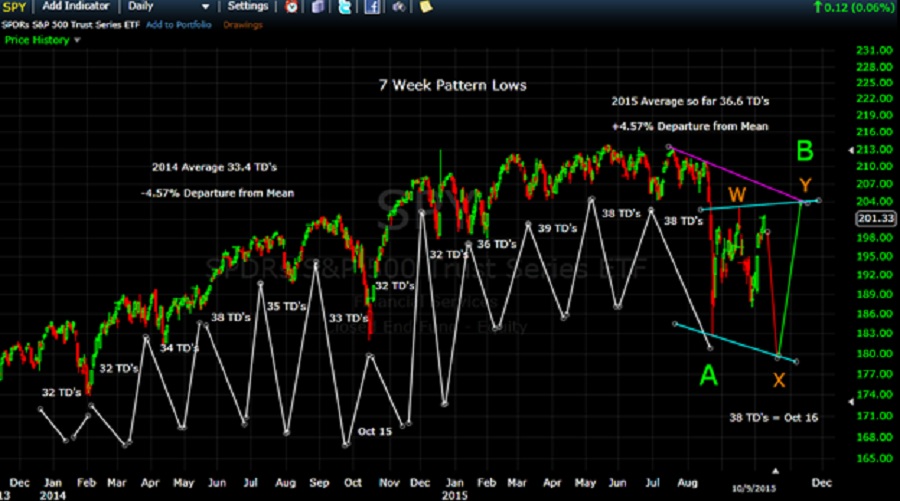
Cycle wise, we have the 7-week low due between October 13-19, with an ideal date of October 16 based on the recent runs of 38 TD’s and the e-wave analysis combined with the current astro analysis. The current Bradley shows a turn due between October 8-10 with a middle power turn combined with a strong Mercury/Venus declination (last one was September 17), and another due on October 17th. This weekend sees the Sun opposing Uranus while Venus squares Saturn. This ends the Sun’s translation to the Uranus/Pluto square, which in the past has created a sudden and dramatic shift in trend. This spells trouble for both stocks and commodities ahead. Mercury turned direct on October 9th right on the Gann 16 TD stock market top. This is when the precious metals sector tends to have reversals too. We also have the new moon on October 12th, which often times points to a top.
My e-wave/cycle analysis (chart below) shows a bearish complex overall bottoming pattern in the mining sector, which suggests a huge throw down over the next 5-7 TD’s to new lows below $12.00 on GDX (gold and silver are still in a bear market). At the same time, the recent run up in the stock market (charts below) sported an irregular topping pattern suggestive of a huge throw down coming there too.
Later in the week, we have the Sun sesquisquaring Neptune (October 15) while Venus opposes Neptune (October 16) as Mars conjuncts Jupiter on October 17 (pointing to another turn to the upside after a nasty drop). The following week we have Saturn sesquiquadrate Uranus suggestive of a top (along with Mercury square Pluto) on October 22. This (to me) points to a low on October 16th and another one on October 26 (the next Bradley turn) with the intervening high (based on the August 24 low and reaction higher). Another high is due on FED day October 28 right after the full moon. The overall trend should be higher from October 16 into late November or early December. The “c” wave A from August 18-24 is the target I’m looking for on the upside, near 2103/04 on the SPX. GDX should make a low just under $12 around October 19, and then trend much higher into the end of November to between $17-$18 a share.
The up volume on Friday was unusually close to what happened on August 17, a week before the infamous August 24 crash. Next week tends to be a bad one seasonally in the third year of a presidential cycle, so keep that in mind. I don’t know what the catalyst will be, but we do have high tension in the Middle East right now.
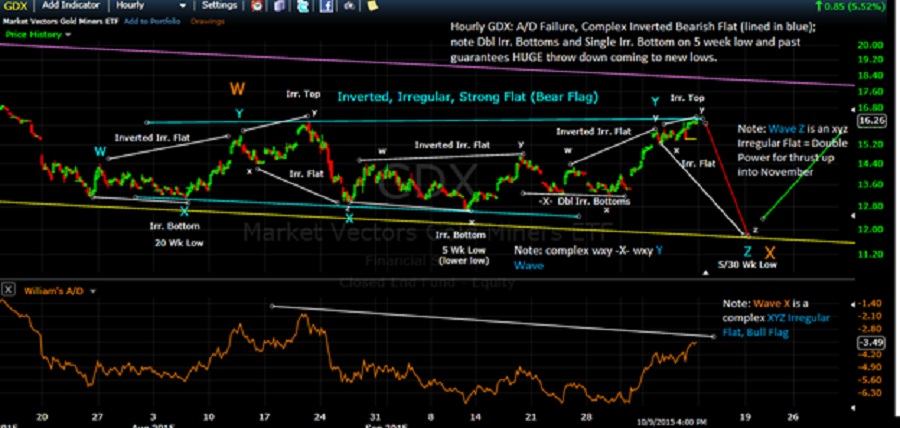
Notice that the 5 week cycle made a new low below the 20 week low on GDX. This is very bearish, as the 5/30 week low is due around Oct 16-20. This confirms the coming stock market plunge. GDX’s 7 week topping pattern is due again late November or early December.
Overall, I do not believe October’s expected plunge will end the downward trend in the stock market. The yearend rally looks to save the day temporarily, but I believe much more pain is coming in the early part of the coming New Year.
********
Brad Gudgeon, editor and author of the BluStar Market Timer, is a market veteran of over 30 years. The subscription website is www.blustarmarkettimer.info
We also offer auto-trading for those who don’t have the time to trade their own accounts.
To view the details more clearly, you may visit our free chart look at http://charts.blustarmarkettimer.com
This web site is sometimes updated periodically as events unfold.
Copyright 2015 BluStar Market Timer


