Technical Analysis Of Major Markets


Gold
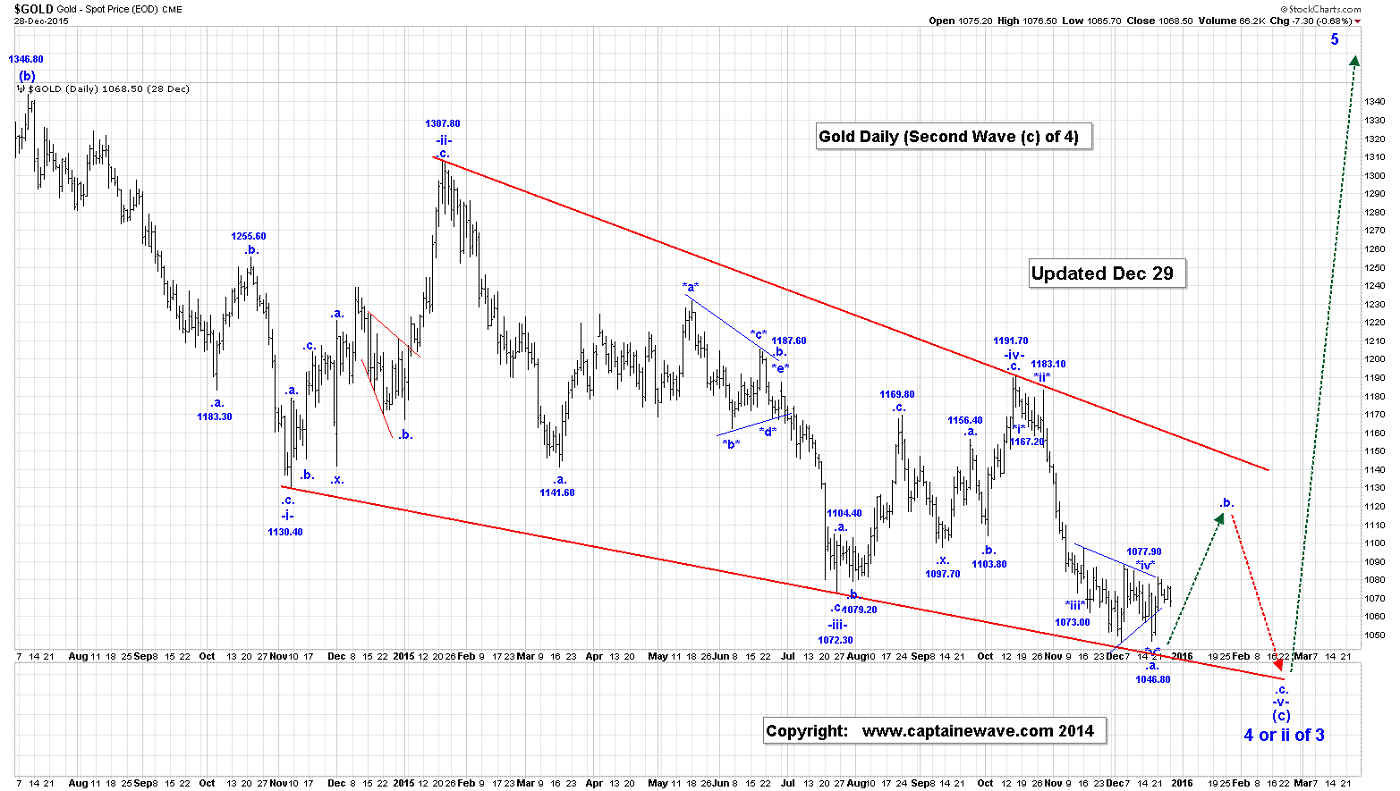
Short Term Update: Gold rallied to 1074.30 in the overnight session, before giving almost all of it back.
We still would like to see gold hit our 50% retracement level of 1063.80 to complete all of wave ^ii^.
We still expect a little more weakness before we blast higher, in the continuation of wave ^iii^ of *a* of .b.
A break above 1076.60 and more importantly 1081.20, would confirm to us that wave ^ii^ ended at 1065.80.
Our retracement level for wave ^ii^ is:
50% = 1063.80;
61.8% = 1059.70.
Longer Term Outlook: Retracements for the end of wave .b. are:
50% = 1119.10;
61.8% = 1136.20.
Wave .b. is expected to consist of at least one *a*, *b*, *c* pattern.
There is an outside chance that all of wave 4 or wave ii of 3 is complete at the 1046.40 low also.
Active Trading Positions: Long 20 positions, with puts at 1085.00!
Crude Oil

Short Term Update: Crude rallied to 37.17 in the overnight session, at the time that this Post was being written.
It looks like we have now completed our first impulsive wave structure from 33.98 to 38.28, so we should now expect a correction that retraces between 50 to 61.8%, as follows:
50% = 36.15;
61.8% = 35.62.
Yesterday's low was 36.62, which is above our 50% retracement level of 36.15. On the Intraday Chart, the drop from 38.28 to 36.62 looks impulsive so it is likely just the first leg down of a 3 wave correction.
Our wave ^ii6 correction could looks like:
!a! = 36.62;
!b! rally is now. We would expect wave !b! to rally between 50 to 61.8% of the wave !a! drop. Those values would be 37.45 and 37.65.
!c! drop to at least 36.62, but more likely to our 50 to 61.8% retracement zone shown above.
Longer Term Outlook: Our current wave (iv), looks like:
-a- = 49.33:
-b-:
*a* = 43.21;
*b* = 50.91;
*c* ending diagonal triangle = 33.98, to complete all of wave -b-;
-c-:
*i*:
^i^ = 38.28;
^ii^:
!a! = 36.62;
!b! rally now;
!c! drop to complete all of wave ^ii^.drop is now.
Projections for the end of wave -c- are:
-c- = 1.618-a- = 52.72;
-c-= 2.618-a- = 64.30: Our preferred target.
Active Trading Positions: Long 15 positions, with 42.00 puts, as stops, plus long 5 positions with 37.00 puts, as stops!
S&P500

Short Term Update: The S&P Futures were up about 9 points, at the time that this Post was being written. We are believe that wave *i* of .c. of -v- ended at 2067.36 and that the current setback is wave *ii*. Retracements for the end of wave *ii* are:
50% = 2036.42;
61.8% = 2029.12.
Yesterday's low in the S&P was 2044.20, which was a little short of our 50% retracement level. We suspect that wave *ii8 is still not complete at the 2044.20 low. A break now above the wave *i* high of 2067.36, would indicate that wave *ii* was rather shallow, ended at 2044.20 and wave *iii* has begun.

Longer Term Outlook: Upon completion of wave *ii* we expect the S&P to move sharply higher in wave *iii* of .c. of -v-. …….. and then collapse!
Active Trading Positions: None!
USDX

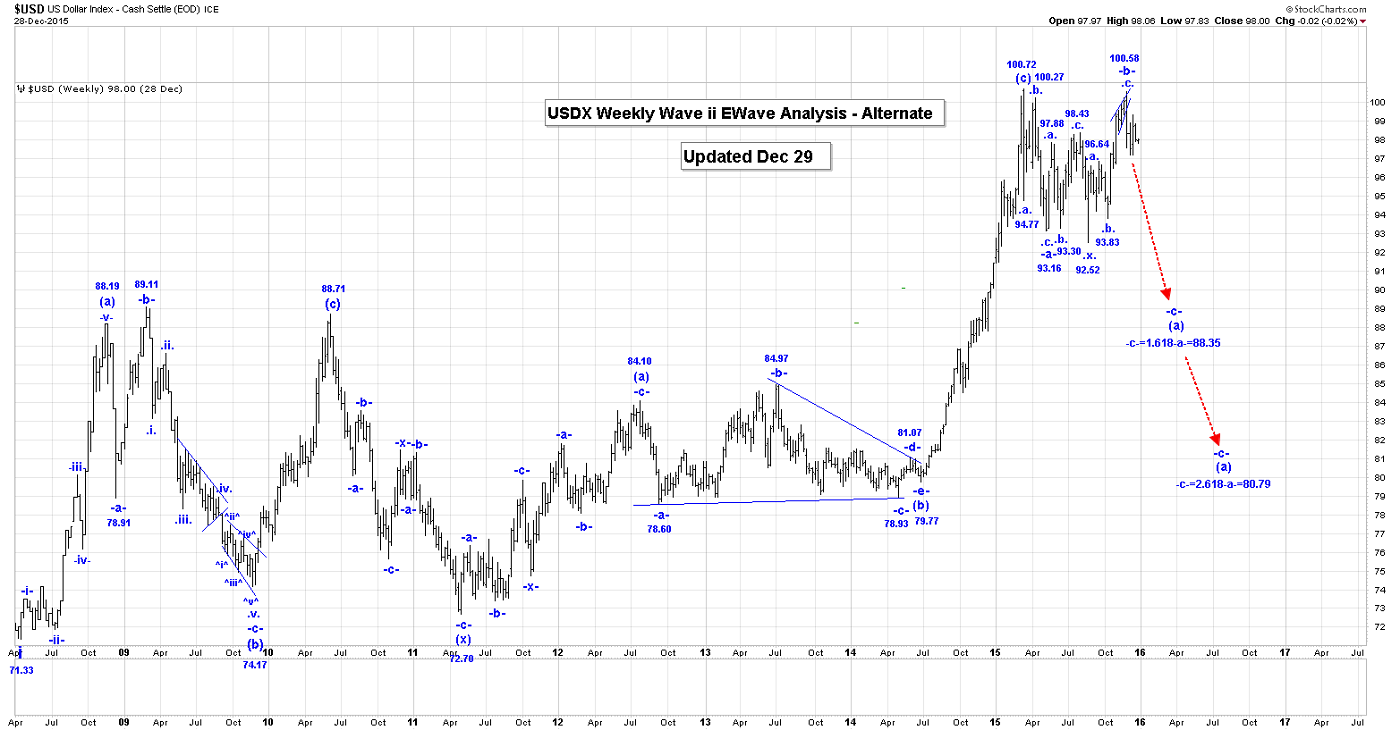
Short Term Update: The USDX was stable in the overnight session, reaching 98.11, at the time that this Post was being written.
We are currently not sure whether all of wave ^ii^ of *c* ended at 98.66, or whether we working on a continuation of that wave, which would suggest that we are now heading back to the 98.66 to complete all of wave ^ii^.
This type of wave *^ii^ formation would be called a flat. If the USDX continues to drop from here, then we can conclude that all of wave ^ii^ is complete at the 98.66 high and wave ^iii^ lower has begun.
On the Intraday Chart the drop from 98.66 to 97.84, does not have an impulsive look to it at the moment, so we should expect that we might be heading back to the 98.66 high to complete all of a flat type irregular wave ^ii^ correction.
The USDX would need to sharp dropping sharply for us to now consider that all of wave ^ii^ ended at the 98.66 high.
Longer Term Outlook: Assuming that we are still working on wave .iv. our updated count is as follows:
*a* = 97.59;
*b* = 99.35;
*c*:
^i^ = 98.01;
^ii^ =98.66, if complete, with the following retracement levels:
50% = 98.68;
61.8% = 98.84
^iii^ will follow after the completion of wave ^ii^.
Our current count for all of wave -v- is:
.i. = 96.64;
.ii. = 93.83;
.iii. = 100.58;
.iv. is still underway;
.v. rally to go to at least the 100.71, wave -iii- high.
We are also watching our alternate count, and need to see a drop below the 96.64 high for this alternate to become active.
Active Trading Positions: Short 5 at 99.25, risking to 99.40!
NatGas

Short Term Update: NG continued to rally in the overnight session, reaching 2.307, at the time that this Post was being written. NG has now rallied about 36%, from 1.693 to 2.307, so we are very cautious now, as at least wave .i. of -a- of (iv) could be very near complete.
Upon completion of wave .i. we should expect a correction to retrace between 50 to 61.8% of wave .i.. We plan to take profits upon any weakness and then will go long again at the end of the upcoming correction. We raised our profit lock to 2.34!
Longer Term Outlook: Our retracement levels for all of wave (iv):
23.6% = 2.34;
38.2% = 2.91;
50% = 3.29.
For the time being we have labelled this first impulsive sequence as wave .i. of -a- of (iv).
It is a bit too early to determine what pattern wave (iv) could take, but as a minimum it will consist of at least one -a-, -b-, -c- pattern, but could also be a triangle. Wave (iv) should take many months to unfold.
Active Trading Positions: Long 5 positions, with stops at 2.28!
HUI/GDX/Gold Stocks
Short Term Update: We are working on the assumption that all or most of wave *ii* is complete at the 13.67 low for GDX.
If wave *i* ended at 14.29, then expected retracements for wave *ii* would be:
50% = 13.74;
61.8% = 13.61.
Yesterday's low of 13.67 did put us within this retracement range.
If wave *ii* is complete the next big event will a sharp rally in wave *iii*. We need to see a break of 15.61, to confirm our current count for this market....wave B ending at 12.62.
Longer Term Outlook:
It looks like wave B ended at 12.62, and we have started wave C higher. Within the initial stages of wave C, we have the following count:
-i- = 17.04;
-ii- = 12.92;
-iii-:
.i. = 13.95;
.ii. = 13.19;
.iii.:
*i* = 14.29;
*ii* = 13.67, if complete;
*iii*higher is next.
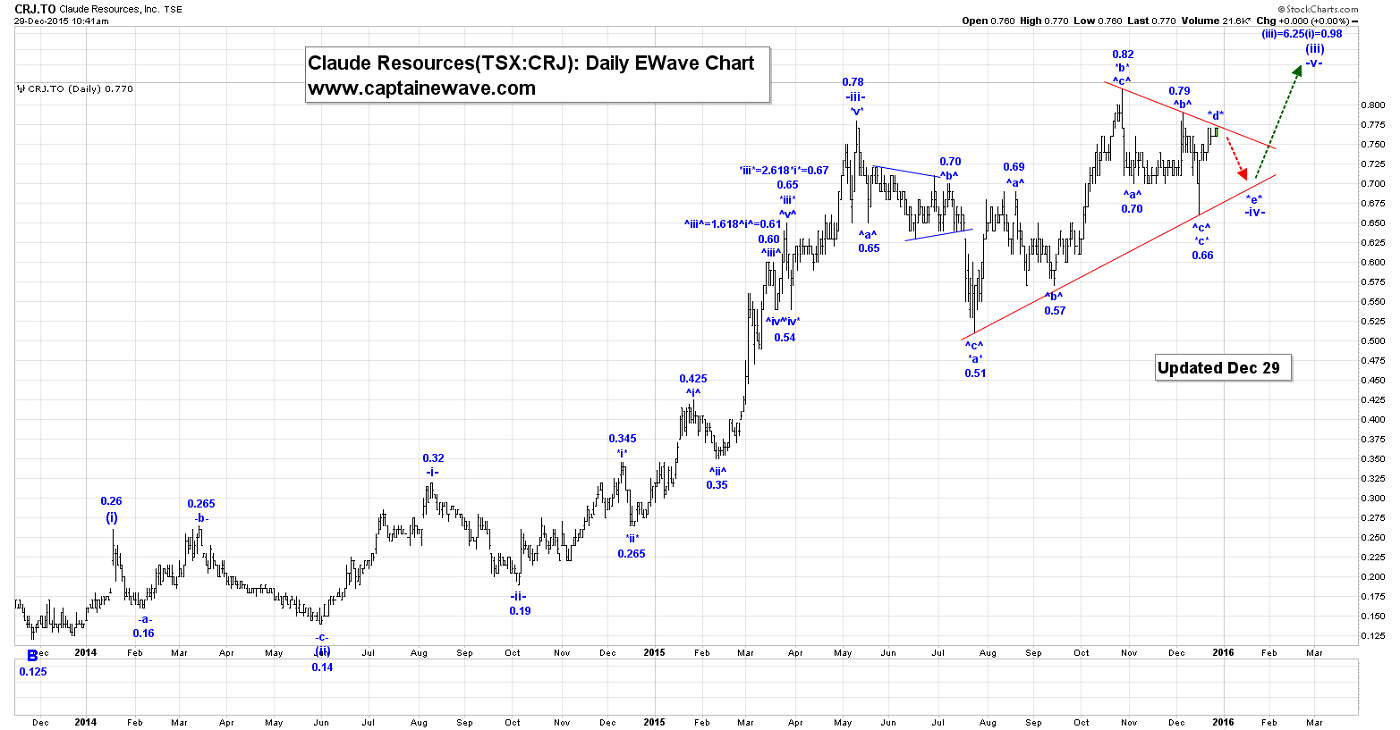
That’s our bell weather stock, Claude Resources, which we believe is a better indicator of what is coming for the entire gold stock sector than even GDX or the HUI index. The price is coiling in a triangle pattern and we anticipate more upside action very soon!


Barrick continues to show a lot of “back and fill” action. The company has shed a lot of debt, and we expect it to follow Claude to the upside on the next significant rally!
Active Trading Positions: We are long the GDX, ABX, KGC, NEM, CRJ, and TSX:XGD, with no stops!
********
Email: [email protected]
Website: www.captainewave.com
Risk: CAPTAINEWAVE.COM IS AN IMPERSONAL ADVISORY SERVICE. AND THEREFORE, NO CONSIDERATION CAN OR IS MADE TOWARD YOUR FINANCIAL CIRCUMSTANCES. ALL MATERIAL PRESENTED WITHIN CAPTAINEWAVE.COM IS NOT TO BE REGARDED AS INVESTMENT ADVICE, BUT FOR GENERAL INFORMATIONAL PURPOSES ONLY. TRADING STOCKS DOES INVOLVE RISK, SO CAUTION MUST ALWAYS BE UTILIZED. WE CANNOT GUARANTEE PROFITS OR FREEDOM FROM LOSS. YOU ASSUME THE ENTIRE COST AND RISK OF ANY TRADING YOU CHOOSE TO UNDERTAKE. YOU ALSO AGREE TO BEAR COMPLETE RESPONSIBILITY FOR YOUR INVESTMENT RESEARCH AND DECISIONS AND ACKNOWLEDGE THAT CAPTAINEWAVE.COM HAS NOT AND WILL NOT MAKE ANY SPECIFIC RECOMMENDATIONS OR GIVE ADVICE TO YOU OR ANY OF ITS CLIENTS UPON WHICH THEY SHOULD RELY. CAPTAINEWAVE.COM SUGGESTS THAT THE CLIENT/MEMBER TEST ALL INFORMATION AND TRADING METHODOLOGIES PROVIDED AT OUR SITE THROUGH PAPER TRADING OR SOME OTHER FORM OF TESTING. CAPTAINEWAVE.COM, ITS OWNERS, OR ITS REPRESENTATIVES ARE NOT REGISTERED AS SECURITIES BROKER-DEALERS OR INVESTMENT ADVISORS EITHER WITH THE U.S. SECURITIES AND EXCHANGE COMMISSION OR WITH ANY STATE SECURITIES REGULATORY AUTHORITY. WE RECOMMEND CONSULTING WITH A REGISTERED INVESTMENT ADVISOR, BROKER-DEALER, AND/OR FINANCIAL ADVISOR. IF YOU CHOOSE TO INVEST WITH OR WITHOUT SEEKING ADVICE FROM SUCH AN ADVISOR OR ENTITY, THEN ANY CONSEQUENCES RESULTING FROM YOUR INVESTMENTS ARE YOUR SOLE RESPONSIBILITY.
ALL INFORMATION POSTED IS BELIEVED TO COME FROM RELIABLE SOURCES. CAPTAINEWAVE.COM DOES NOT WARRANT THE ACCURACY, CORRECTNESS, OR COMPLETENESS OF INFORMATION AVAILABLE FROM ITS SERVICE AND THEREFORE WILL NOT BE LIABLE FOR ANY LOSS INCURRED. DUE TO THE ELECTRONIC NATURE OF THE INTERNET, THE CAPTAINEWAVE.COM WEBSITE, ITS E-MAIL & DISTRIBUTION SERVICES AND ANY OTHER SUCH "ALERTS" COULD FAIL AT ANY GIVEN TIME. CAPTAINEWAVE.COM WILL NOT BE RESPONSIBLE FOR UNAVAILABILITY OF USE OF ITS WEBSITE, NOR UNDELIVERED E-MAILS, OR "ALERTS" DUE TO INTERNET BANDWIDTH PROBLEMS, EQUIPMENT FAILURE, OR ACTS OF GOD. CAPTAINEWAVE.COM DOES NOT WARRANT THAT THE TRANSMISSION OF E-MAILS, OR ANY "ALERT" WILL BE UNINTERRUPTED OR ERROR-FREE. CAPTAINEWAVE.COM WILL NOT BE LIABLE FOR THE ACTS OR OMISSIONS OF ANY THIRD PARTY WITH REGARDS TO CAPTAINEWAVE.COM DELAY OR NON-DELIVERY OF THE CAPTAINEWAVE.COM NIGHTLY EMAILS OR "ALERTS". FURTHER, WE DO NOT RECEIVE ANY FORM OF PAYMENT OR OTHER COMPENSATION FOR PUBLISHING INFORMATION, NEWS, RESEARCH OR ANY OTHER MATERIAL CONCERNING ANY SECURITIES ON OUR SITE OR PUBLISH ANY INFORMATION ON OUR SITE THAT IS INTENDED TO AFFECT OR INFLUENCE THE VALUE OF SECURITIES.
THERE IS NO GUARANTEE PAST PERFORMANCE WILL BE INDICATIVE OF FUTURE RESULTS. NO ASSURANCE CAN BE GIVEN THAT THE RECOMMENDATIONS OF CAPTAINEWAVE.COM WILL BE PROFITABLE OR WILL NOT BE SUBJECT TO LOSSES. ALL CLIENTS SHOULD UNDERSTAND THAT THE RESULTS OF A PARTICULAR PERIOD WILL NOT NECESSARILY BE INDICATIVE OF RESULTS IN FUTURE PERIODS. THE RESULTS LISTED AT THIS WEBSITE ARE BASED ON HYPOTHETICAL TRADES. PLAINLY SPEAKING, THESE TRADES WERE NOT ACTUALLY EXECUTED. HYPOTHETICAL OR SIMULATED PERFORMANCE RESULTS HAVE CERTAIN INHERENT LIMITATIONS. UNLIKE AN ACTUAL PERFORMANCE RECORD, SIMULATED TRADES DO NOT REPRESENT ACTUAL TRADING. ALSO, SINCE THE TRADES HAVE NOT ACTUALLY BEEN EXECUTED, THE RESULTS MAY HAVE OVER OR UNDER COMPENSATED FOR THE IMPACT, IF ANY, OF CERTAIN MARKET FACTORS SUCH AS LACK OF LIQUIDITY. YOU MAY HAVE DONE BETTER OR WORSE THAN THE RESULTS PORTRAYED. NO REPRESENTATION IS BEING MADE THAT ANY ACCOUNT WILL OR IS LIKELY TO ACHIEVE PROFITS OR LOSSES SIMILAR TO THOSE SHOWN. NO INDEPENDENT PARTY HAS AUDITED THE HYPOTHETICAL PERFORMANCE CONTAINED AT THIS WEBSITE, NOR HAS ANY INDEPENDENT PARTY UNDERTAKEN TO CONFIRM THAT THEY REFLECT THE TRADING METHOD UNDER THE ASSUMPTIONS OR CONDITIONS SPECIFIED HEREAFTER. WHILE THE RESULTS PRESENTED AT THIS WEBSITE ARE BASED UPON CERTAIN ASSUMPTIONS BELIEVED TO REFLECT ACTUAL TRADING CONDITIONS, THESE ASSUMPTIONS MAY NOT INCLUDE ALL VARIABLES THAT WILL AFFECT, OR HAVE IN THE PAST AFFECTED, THE EXECUTION OF TRADES INDICATED BY CAPTAINEWAVE.COM. THE HYPOTHETICAL RESULTS ON THIS WEBSITE ARE BASED ON THE ASSUMPTION THAT THE CLIENT BUY AND SELLS THE POSITIONS AT THE OPEN PRICE OF THE STOCK. THE SIMULATION ASSUMES PURCHASE AND SALE PRICES BELIEVED TO BE ATTAINABLE. IN ACTUAL TRADING, PRICES RECEIVED MAY OR MAY NOT BE THE SAME AS THE ASSUMED ORDER PRICES.


