Trade War Talks And Geopolitics Will Continue Guiding Metals Markets


The increasingly tense relationship between the world’s two largest economies continues to be defined by impasses in the trade policy discussion between Chinese President Xi Jinping and U.S. President Donald Trump. Within the equities markets, the effects of these disagreements have become striking —and they suggest general volatility levels are likely to continue moving higher.
The Dow Jones Industrials are still trading above the 25,000 level, which is a critical psychological area that is often watched closely by the financial markets. But it seems to be just a matter of time before this level breaks, as deteriorating investor sentiment has combined with weakened corporate earnings expectations and a very negative technical chart picture for equities. If this downside break does occur, we can reasonably expect traders to sell equities and move more forcefully into the precious metals space as a renewed safe haven.

When determining potential trend changes in these types of environments, I like to analyze market data which highlight inflow/outflow activity in popular exchange-traded funds. In trend terms, I believe this works as an excellent sentiment indicator because we are able to view different behavioral activities in the market within the context of clearly defined time intervals.
For the Dow, the market’s best fund indicator by volume is the SPDR Dow Jones Industrial Average ETF (DIA), which closed at 256.67 on Monday and is holding just above important short-term support levels from March 22, 2019 (at 252.46). The ETF has already broken its 50-day and 200-day exponential moving averages, and prior bearish divergences in the MACD indicator have been confirmed with a negative turn in the histogram.
Moreover, these significant declines in DIA came as the ETF reached important resistance levels from last October. As a result, we now have a clear double top formation in DIA which could limit further upside momentum in the ETF during the first half of 2019.
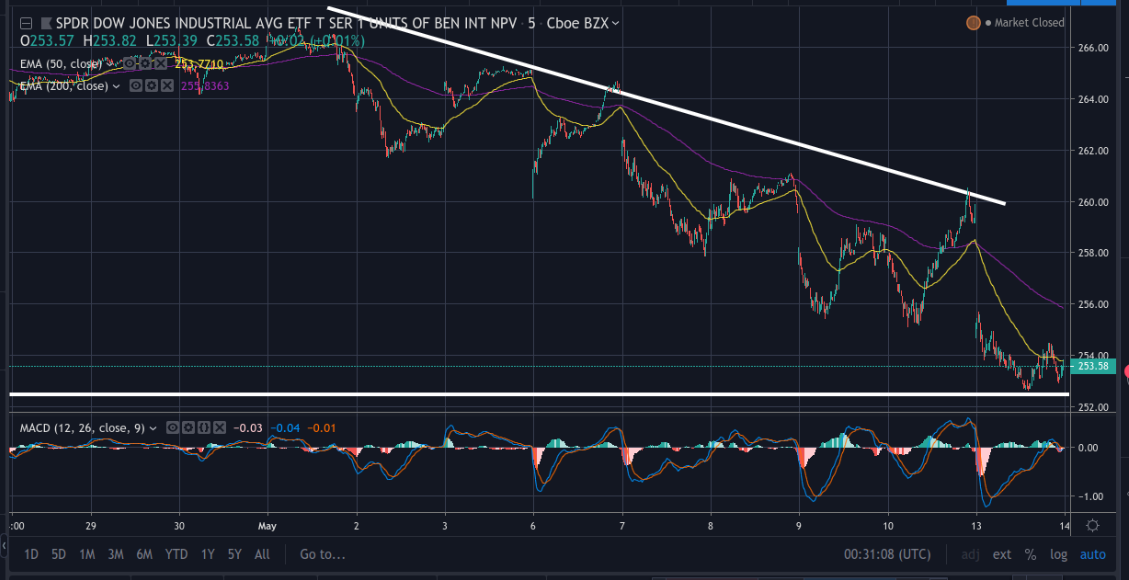
Here is a closer look at DIA’s recent declines, and we can see that moves to the downside have been quite sizable. But what’s most alarming about these events is the fact that ETF flow figures actually pointed to this negative outcome all along. For the most recent 4-week period, DIA is showing inflow figures of $848.0 million. However, this activity diverges sharply from the figures posted during the most recent 26-week period (which show much more significant outflows of $1,232.6 million).
In reality, there are no coincidences in the financial markets. The fact that contrasting flow disparities in DIA became apparent during a period defined by a double top formation suggests prior record highs in DIA were unsustainable. Traders that were able to spot this divergence in the flow data may have been ready for the drop and captured profits while the opportunity was still present. Now that the dominant moves have occurred, it is time to focus on the asset classes most likely to benefit from continued geopolitical uncertainties (namely, the precious metals).
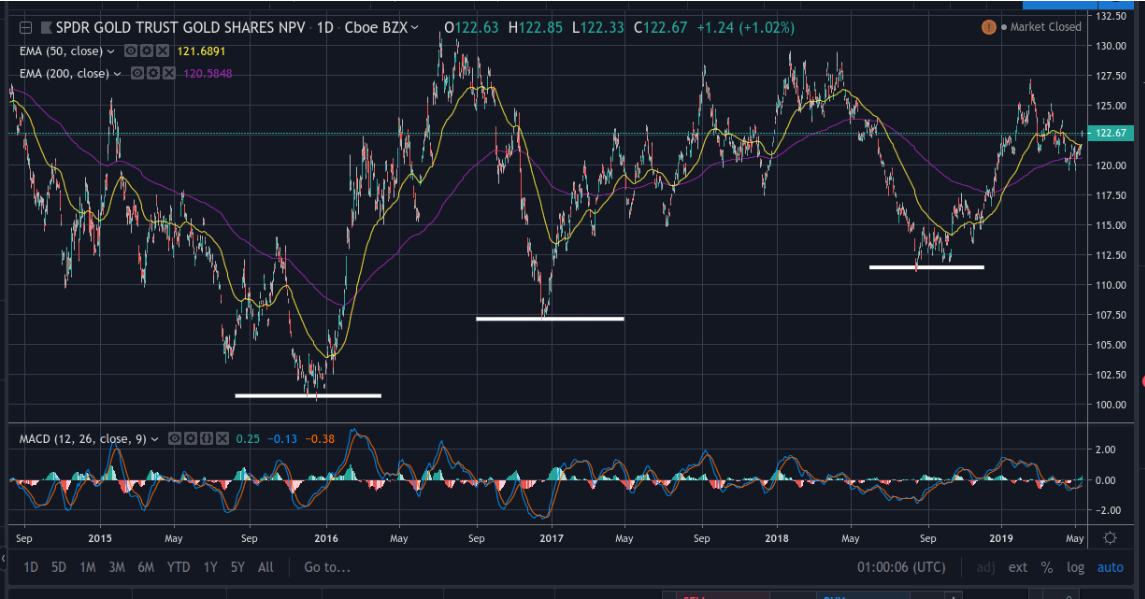
Interestingly, the daily chart for the SPDR Gold Trust ETF (GLD) gives us an entirely different picture when compared to the broader trends visible in DIA. In this case, what we have is an uptrend that is being built upon a strong foundation that is more than three years old. Furthermore, GLD has not experienced forceful rejections at the highs in ways that are similar to the underlying trends in DIA. On balance, this suggests precious metals are in a much better position to experience extended rallies during the second half of 2019.
After the major declines in stocks, GLD broke above its hourly downtrend and this suggests rising bullish momentum in the precious metals complex. As a result, the recent short-term pullback in the ETF is starting to look like an excellent buying opportunity (as long as support levels near 119.60 hold firm). For GLD, limited resistance levels can now be spotted overhead (at 123.80) but a clear break should quickly force a retest of the 2019 highs just above 127.20.
In order for this bullish metals forecast to be disrupted, we would need to see a major reduction in stock volatility levels. If, however, we fail to see material progress on the U.S - China trade war front, this is looking extremely unlikely in the weeks ahead. Overbought equities markets continue to reduce favorable prospects for stock trades with suitable risk-reward ratios. Additionally, the bearish severity of recent events would only be exacerbated if economic data reports out of Europe show further declines. For these reasons, it is much more likely that precious metals instruments will benefit from the mass exodus in global equities which has been inspired by continued tensions in trade policy.
Going forward, investors should continue watching for trading clues in the underlying flow figures which define the dominant trends in popular exchange-traded funds. As we can see from recent examples in exchange-traded funds (such as DIA), this information could be critically important in signaling potential trade reversal setups in the months ahead.


