Is The U.S. "Decoupling" from The European Crisis?


Selling pressure earlier in the week gave way to strong demand for equities as concerns over the European debt crisis have been moved to the backburner. Investors have instead been focusing on the improved U.S. economic and employment picture.
In an article by Reuters reporter Edward Krudy earlier this week there was a significant quote worth mentioning. The quote is from Ryan Larson, head of equity trading at RBC Global Asset Management. Larson said, "The U.S. appears to be slowly, slowly in the early stages of a decoupling from the euro zone."
There's no denying that the U.S. stock market is showing technical resilience on a short-term basis, and that's mainly due to the fact that two dominant interim weekly Kress cycles are still in their peaking phase. Strong internal momentum as reflected in the NYSE HILMO (Hi-Lo Momentum) indicators shown below is another driving force behind this rally. It's also a reason why I think it's premature to sell this rally short as some analysts are suggesting. But Mr. Larson's final statement to the effect that the U.S. appears to be "decoupling" from the euro zone is a theme that needs to be addressed.

The "decoupling" theme is the same terminology that was used to describe the divergence between U.S. equity prices and global commodity prices, especially crude oil, in the first half of 2008 before the credit crisis got out of hand. Below is a chart showing the Oil ETF (OIL), a proxy for the oil price. Compare the performance of OIL in the first half of 2008 against the second half of the year.
This was surely a deceptive appearance and it bred a false sense of security among a multitude of investment analysts, most of whom assumed that oil and other commodities in high demand among the Asian economies were "decoupling" from the U.S. financial market and economy and would therefore be immune to the credit crisis. Of course this assumption was exploded in the summer and fall of 2008 as the above chart shows.
The eurozone debt crisis is still heating up and hasn't yet come to a head. When it does, it's almost certain that neither the U.S. nor any other global financial market participant will be immune. The residual effects will spill over into the U.S. market much as the U.S. debt crisis of 2008 spilled over into the rest of the world. Analysts seem to have forgotten the lesson from the 2008 crisis, namely that "no one is immune" and that when it comes to markets, there's no such thing as decoupling.
Expect the decoupling myth to gain more credence in the near term as long as U.S. equity markets shown any sign of strength. We should also expect that by the last of the weekly cycle peaks in March, "decoupling" will likely be revealed for what it really is: an illusion.
For now, the near term upward bias in the stock market has lulled many investors and analysts into complacency. Our indicators haven't yet signaled that the rally is over and with the interim weekly cycles still peaking there should be some more life in this uptrend. But as we head further into February it will be time to become more cautious and evaluate the internal condition of the market for signs that the tide is about to turn.
U.S. Economy
Let's take a look at the latest economic reports since this is what traders were focusing on all week. According to Reuters, "The economy grew at its fastest pace in 1-1/2 years in the fourth quarter, but a rebuilding of stocks by businesses and slower business spending warned of weaker growth in early 2012."
Meanwhile on Feb. 3, the Dow 30 index was in the headlines today after making its highest close since before the 2008 financial crisis hit. The market was buoyed by news that unemployment hit a 3-year low. The NASDAQ 100 Index, meanwhile, hit levels not seen since December 2000.
In another sign that the domestic economy has firmed up over the past few months, the Commerce Department reported last week that U.S. gross domestic product (GDP) increased at a 2.8 percent annual rate, a sharp acceleration from the 1.8 percent in the previous three months. Durable goods orders rose 3 percent last month as businesses ramped up spending. In December, orders for core capital goods rose to a record $68.9 billion, according to USA Today, more than 45 percent higher than the recession low of 2009.
Consumer spending, which accounts for about 70 percent of U.S. economic activity, also accelerated, stepping up to a 2 percent rate from the third-quarter's 1.7 percent. It was largely driven by pent-up demand for cars, however, as the Japanese earthquake and tsunami had disrupted supplies early last year.
Our in-house New Economy Index (NEI), which measures the strength of weakness of the U.S. retail economy, told us to expect an improving domestic retail economic picture in the fourth quarter of 2011. It continues to remain above its intermediate-term uptrend and is also above the key 12-week and 20-week moving averages as shown in the chart below.

One of the components of the NEI is the job site Monster Worldwide (MWW). MWW represents the employment component of the index. MWW took a 20% on Jan. 26 on a badly received earnings announcement, but the sharp decline in MWW did little to dent the uptrend in the New Economy Index. The fact that Monster's stock price declined - which was partly blamed on reduced job placements - could be a preliminary warning of trouble ahead for the U.S. employment outlook, however. The overall U.S. retail economic picture remains firm, however, according to the latest readings of the NEI.
Gold Stocks
Previously we examined the dominant intermediate-term momentum indicator for the gold stocks, which has recently turned up. This is a positive development which increases the odds that the XAU exceeds the early December peak at the 210 level and also tests or exceeds the early November peak at 215.
The price of gold has already exceeded its early December peak and is headed up to its November high. The daily chart of the SPDR Gold Trust ETF (GLD) shown below reflects this upward trend and is providing a leading signal for the XAU.
Internal momentum for the gold stocks has improved across the board in recent days. The following chart shows another important indicator, namely the sub-dominant interim momentum trend. This indicator has been particularly strong of late and is showing the most acceleration lately of the internal momentum indicators which comprise the indicator series known as GOLDMO. What makes this significant is that the weekly cycle which most closely corresponds to this indicator is in its peaking phase right now, which increases the chances of a continued gold stock market rally.
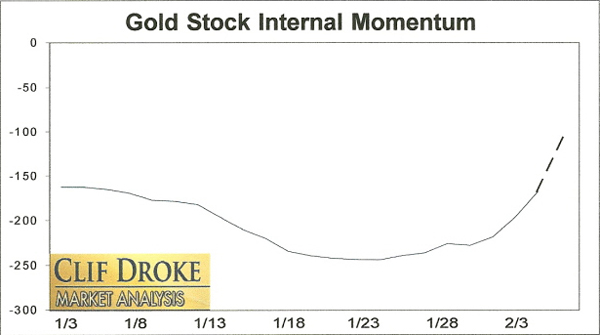
Moreover, the anticipated rate of acceleration for this momentum indicator (based on a forward projection of the rate of change) is illustrated by the dotted line and arrow in the above chart.
Seasonal strength for the gold stocks begins in February, which should also assist in keeping the mining stocks buoyant while the cycle peaks. This cycle is an equity market cycle and not specifically a gold stock cycle, but there is a spillover effect which is clearly benefiting the gold and silver stocks right now.
Gold & Gold Stock Trading Simplified
With the long-term bull market in gold and mining stocks in full swing, there exist several fantastic opportunities for capturing profits and maximizing gains in the precious metals arena. Yet a common complaint is that small-to-medium sized traders have a hard time knowing when to buy and when to take profits. It doesn't matter when so many pundits dispense conflicting advice in the financial media. This amounts to "analysis into paralysis" and results in the typical investor being unable to "pull the trigger" on a trade when the right time comes to buy.
Not surprisingly, many traders and investors are looking for a reliable and easy-to-follow system for participating in the precious metals bull market. They want a system that allows them to enter without guesswork and one that gets them out at the appropriate time and without any undue risks. They also want a system that automatically takes profits at precise points along the way while adjusting the stop loss continuously so as to lock in gains and minimize potential losses from whipsaws.
In my latest book, "Gold & Gold Stock Trading Simplified," I remove the mystique behind gold and gold stock trading and reveal a completely simple and reliable system that allows the small-to-mid-size trader to profit from both up and down moves in the mining stock market. It's the same system that I use each day in the Gold & Silver Stock Report - the same system which has consistently generated profits for my subscribers and has kept them on the correct side of the gold and mining stock market for years. You won't find a more straight forward and easy-to-follow system that actually works than the one explained in "Gold & Gold Stock Trading Simplified."
The technical trading system revealed in "Gold & Gold Stock Trading Simplified" by itself is worth its weight in gold. Additionally, the book reveals several useful indicators that will increase your chances of scoring big profits in the mining stock sector. You'll learn when to use reliable leading indicators for predicting when the mining stocks are about o break out. After all, nothing beats being on the right side of a market move before the move gets underway.
The methods revealed in "Gold & Gold Stock Trading Simplified" are the product of several year's worth of writing, research and real time market trading/testing. It also contains the benefit of my 14 years worth of experience as a professional in the precious metals and PM mining share sector. The trading techniques discussed in the book have been carefully calibrated to match today's fast moving and volatile market environment. You won't find a more timely and useful book than this for capturing profits in today's gold and gold stock market.
The book is now available for sale at:
www.clifdroke.com/books/trading_simplified.html
Order today to receive your autographed copy and a FREE 1-month trial subscription to the Gold & Silver Stock Report newsletter. Published twice each week, the newsletter uses the method described in this book for making profitable trades among the actively traded gold mining shares.
Clif Droke is the editor of Gold & Silver Stock Report, published each Tuesday and Thursday. He is also the author of numerous books, including most recently, "Gold & Gold Stock Trading Simplified." For more information visit www.clifdroke.com


