US Stock Market: Anatomy Of A Correction


Over the last week we have used market sentiment indicators and index charts to gauge the prospects of finding a high on the post-September relief ‘bounce’ rally.
During August and September market sentiment had become brutally over bearish and this was very dangerous from the bears’ perspective. We set upside bounce targets for the SPX at 2020, 2040, 2060 and 2100. The first three were resistance levels (broken support) and the last was the general measurement of the ‘W’ bottom that formed in August and September. With the extremes in bearish sentiment, it was not so surprising that SPX climbed all the way to just above 2100.
Well, as we have noted in weekly reports and in-week updates recently, that problem for the bears was methodically eliminated by the rally as bulls’ backbones firmed up very well to the point of strenuous (though not hideously extreme) over bullishness. Here is one chart (courtesy Sentimentrader.com) among many sentiment graphics and data points we used in an NFTRH update on November 4. We had been watching pessimism dissipate quite nicely, but now the other component – rapidly growing optimism – was kicking in as well. This would pave the way for a correction from a sentiment standpoint.

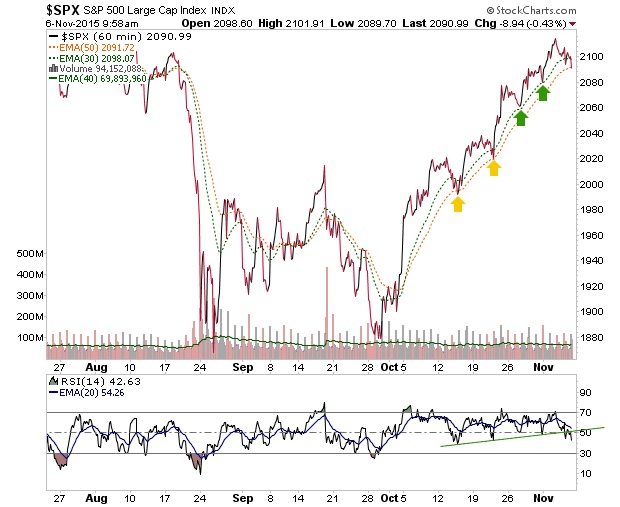
As a ‘look ahead’ we then used and continually updated this 60 minute chart of the SPX beginning with an update called What to Look for w/ Respect to the 1st Signs of a Market Breakdown in order to be prepared to view the very first inkling of what a correction might look like, now that sentiment was coming in line. The ensuing string of updates also included daily charts of SPX for viewing forward-looking support parameters in the event that the market did have an initial breakdown (per the 60 minute view).
The two 60 minute moving averages (EMA 30 & 50) had supported the entire post-September rally and as long as they were intact, there was no bear signal.

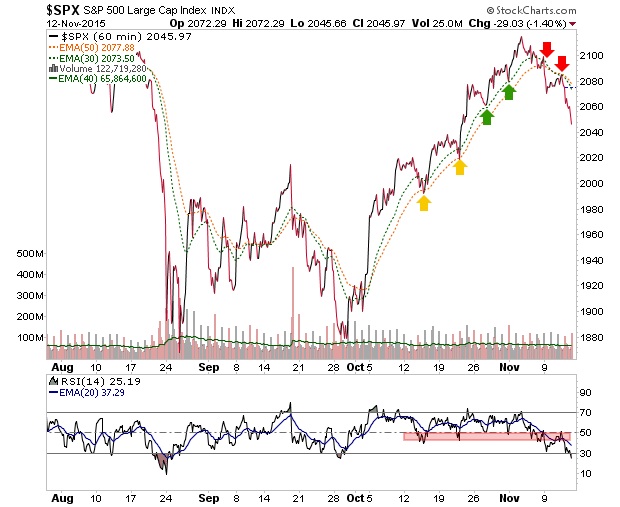
Then two days later it made its initial signal. Here is the chart from another update that went out to subscribers on the spot. We noted that SPX was “on track to begin a reaction, correction or more” as the first moving average gave way and RSI lost support.
On November 9 the signal got better as the second moving average was pierced and the moving averages turned down. We noted SPX could bounce to test the breakdown.

Sure enough it did… and it failed to negate the damage. Thursday morning we had an update shortly after the open showing the next move down after the bounce failure.

Finally, here is how it looks after the close on Thursday.
The 60 minute chart’s usefulness has been expressed and now it is on to the daily views for managing the depth of the reaction/correction and if it gets bad enough, the weeklies and monthlies, which will resume guiding the big picture.
Indeed, let’s end the piece by going from one extreme (hourly) to the other (monthly). This chart included in NFTRH 368 kept me in my bearish positions, even though they had been losing me money on paper (but are now very green, I am happy to say). That dome on SPX’s head and the bearish MACD kept me in the game and not out thinking myself. But there is more work to do, because the other more sensitive momentum indicators could well be mimicking 1998 and 2011 as opposed to 2000 and 2008.

Since the market’s long flat-lining momentum drainage that finally resolved in the August decline, we have successfully gauged and managed every important turn. Down, bottom, bottom re-test, rally and now… the topping of the recovery rally.
I see no reason why people should try to predict how this situation will resolve on the big picture. Ongoing management like the ‘touchy feely’ hourly stuff we did and the daily parameters we are working now are good enough in order to be prepared at any given juncture. Eventually the weeklies and monthlies will make their signals as well. It’s a process folks.
********
Consider joining us as we manage the process before NFTRH’s moderate price increase at year-end.
Subscribe to NFTRH Premium for your 25-35 page weekly report, interim updates and NFTRH+ chart and trade ideas or the free eLetter for an introduction to our work. Or simply keep up to date with plenty of public content at NFTRH.com and Biiwii.com. Also, you can follow via Twitter @BiiwiiNFTRH.


