The USD-Reports Of Its Death Have Been Greatly Exaggerated
 share
share
 share
share
 share
share
 share
share
 share
share
In deference to Mark Twain, I will review the USD, general stock market, precious metals, the electric metals and various other topics. In the past two weeks Rambus has been so prolific with such high impact charts that I find it a challenge to offer value added material so I offer charts with some different perspectives.
USD-No I Am NOT Dead Yet!
Currencies tend to be a very emotional subject. I try to be objective when analyzing them, sticking to the language of the market and its message. It is always important to guard against the gold bug narrative, it can even influence our views of currencies. Demanding posts insisting the USD is toast and immediately headed towards history’s ash heap seem closely related to this gold bug narrative. The USD has spent the first 8 months of 2017 in a well-defined downtrend, however it does not appear to be in a death spiral. Actually the shouting and insistence that it must continue down has been a fairly predictable sign that its move downward was reaching its limit. The dollar may have now completed a base and is set to continue its move higher. This is not dogma as it could reverse downward, but for now it’s making all the right moves if the trend is higher.
Please review Rambus’ October 25 post on the USD as there is no other finer analysis anywhere:
Early Weekend Report…The Dollar Post
I have often made the point that we are in a post bubble contraction. It began with the financial crisis in 2007, however the central banks of the world and their interventions have truncated the natural corrective process and re-inflated the bubble due to financial engineering. Ultimately, if robust growth is to ever return to the world’s economies the PBC must be allowed to do its work in de-levering balance sheets. Historically in the previous 5 episodes over the past 340 years, PBCs have taken 15-20 years to accomplish this. So this is a slow process and the 8 month downtrend of the USD in 2017 could just be a little wiggle that turns out to be just a correction in an ongoing up-trend. Time will tell of course. In a PBC, the senior currency becomes chronically strong and acts as a magnet attracting capital flows from around the world. Over the past year this economic principle has been very hard to accept, however it may be getting ready to reassert itself. I personally don’t trade currencies, however I watch them since they drive asset classes and knowing their trend gives us a clue of where these assets will themselves trend.
It appears we are at a crucial point in currency markets as the USD is beginning to reassert itself. Lets look at the various currency charts vs the USD:
Euro- H&S neckline now broken:
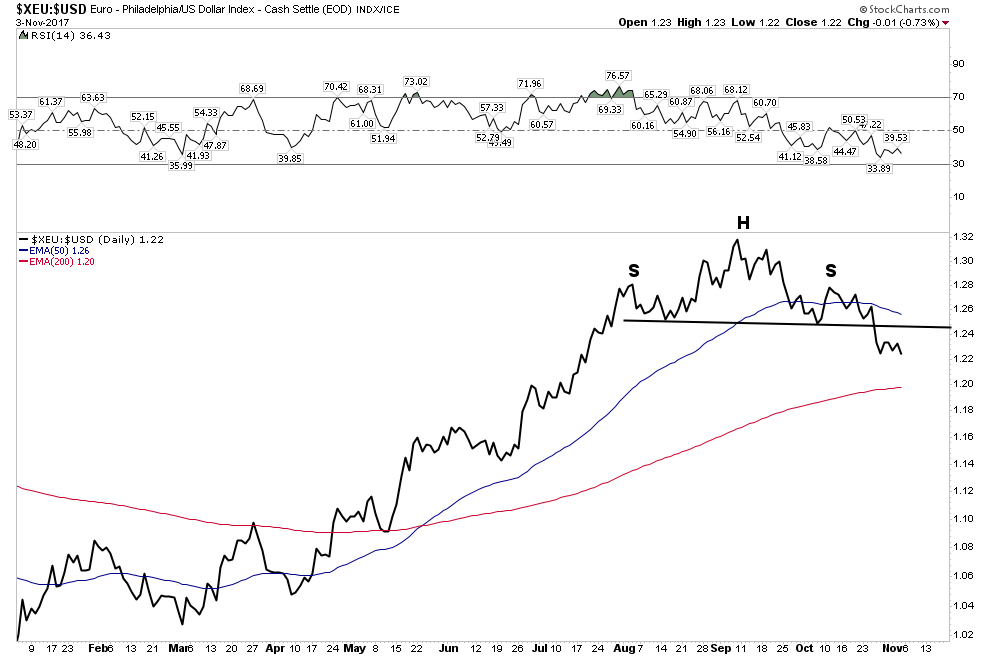
In the chart below we see how the USD has broken above its lower horizontal channel line and is now attempting to overcome the resistance of the 30 W EMA. Stochastics are indicating that it has the momentum to continue its move higher.

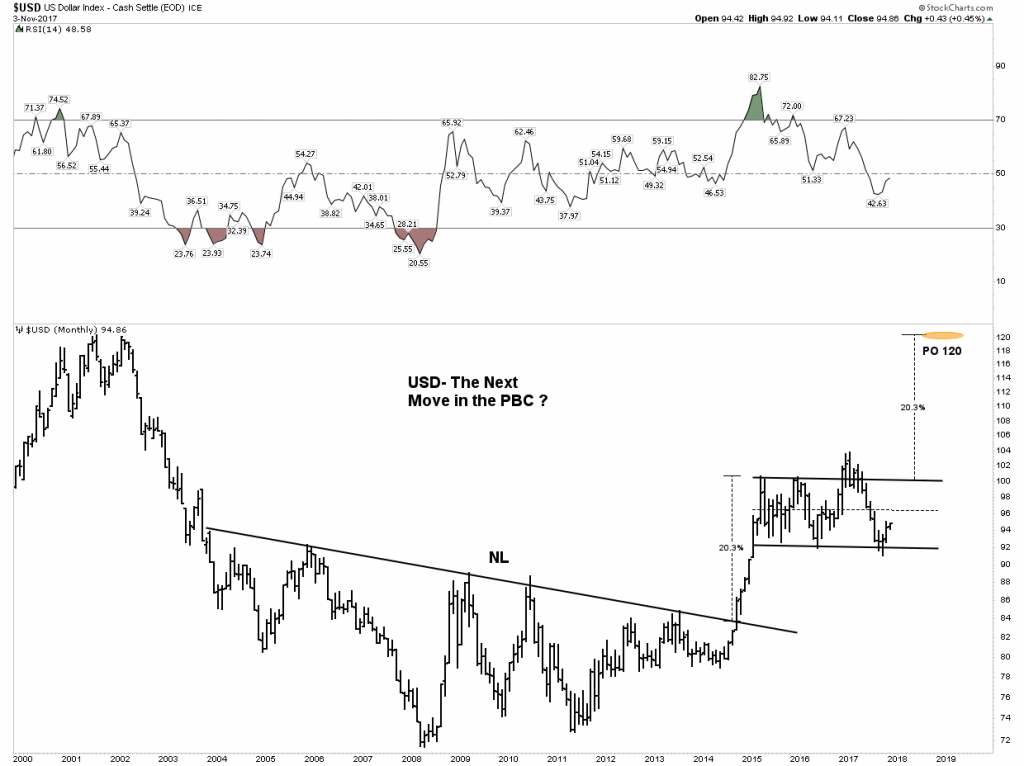
Below is the chart that has been subject to ridicule and derision, however it depicts what could occur when the PBC reasserts itself. It is certainly not a guarantee, however it shows what may lie in store.
This next chart shows the relationship between the USD and the three metals: gold, silver and copper. It is hinting that if the USD continues to rally it could make it difficult for these three metals to advance much further:
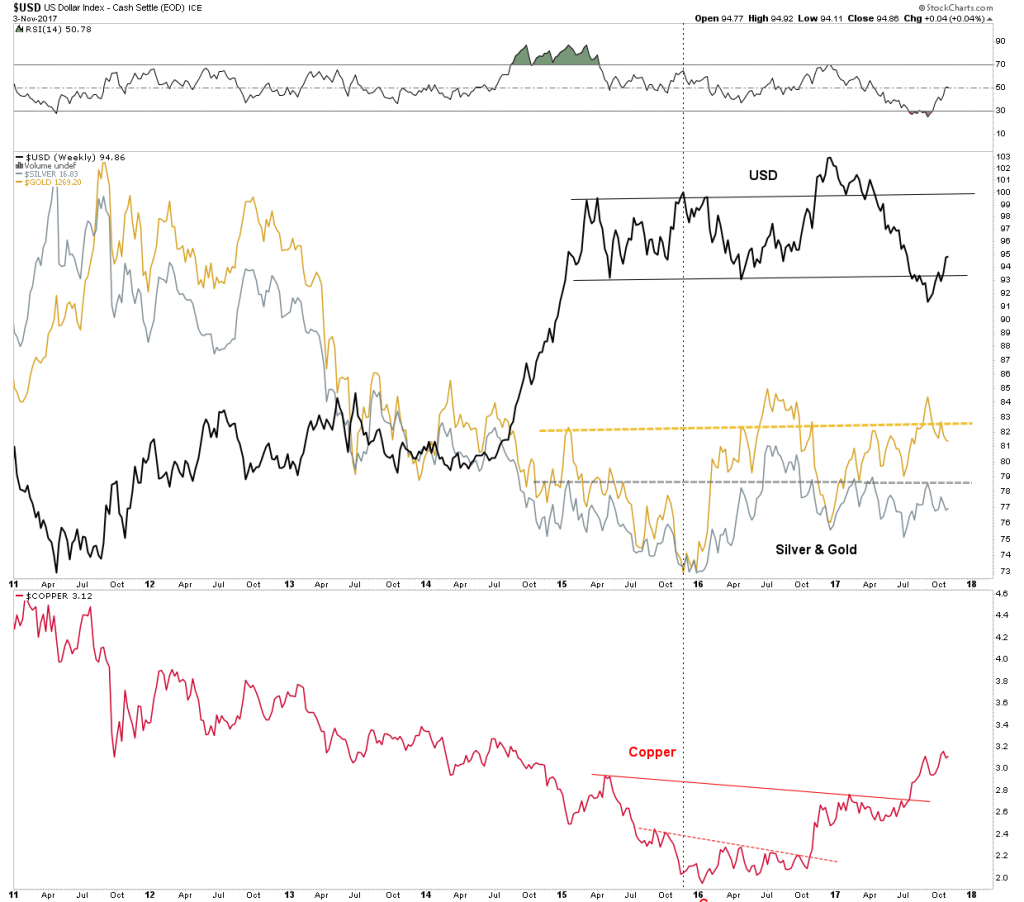
Finally, this USD chart poses the question: are the industrial metals getting ready to end their run for now? It seems that in the past when the USD reversed from being oversold on the weekly that was the message:

Note how extended stochastics and RSI have become. Also note how volume is trailing off despite this recent blow off move.
Precious Metals And The PM Stocks
I discussed the new FED chief in the previous section because ultimately it will have a major impact on the precious metals. When the expanding bubble eventually pops, the gold price and the course of the gold miners will be in relation to the size of the credit bubble created by the FED. Remember a credit bubble is caused by the monetization of debt.
The strengthening US Dollar has been suppressing the price of Gold. This is why I have emphasized one should view gold and the metal stocks through both clear analytical CAD glasses and USD rose colored glasses. With the USD rising the rose colored glasses have now been shattered and reality has asserted itself and its getting ugly.
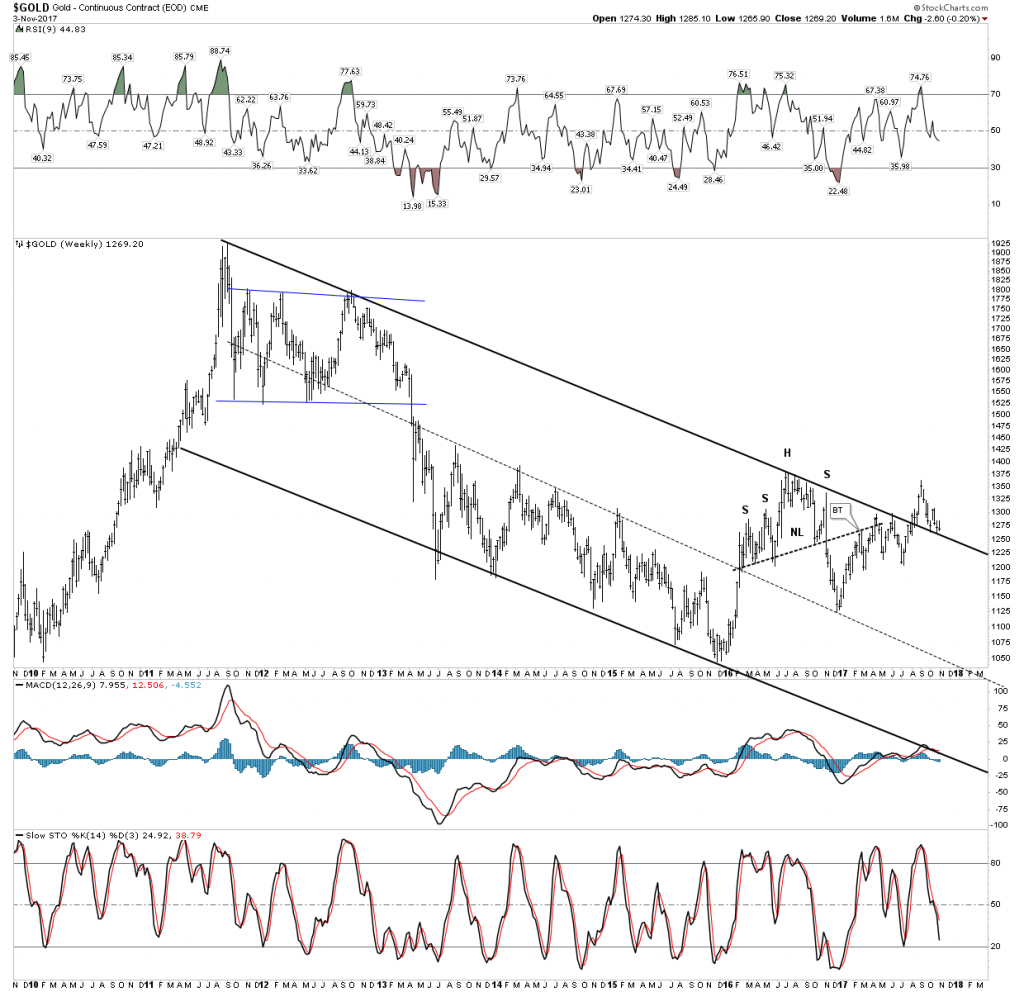
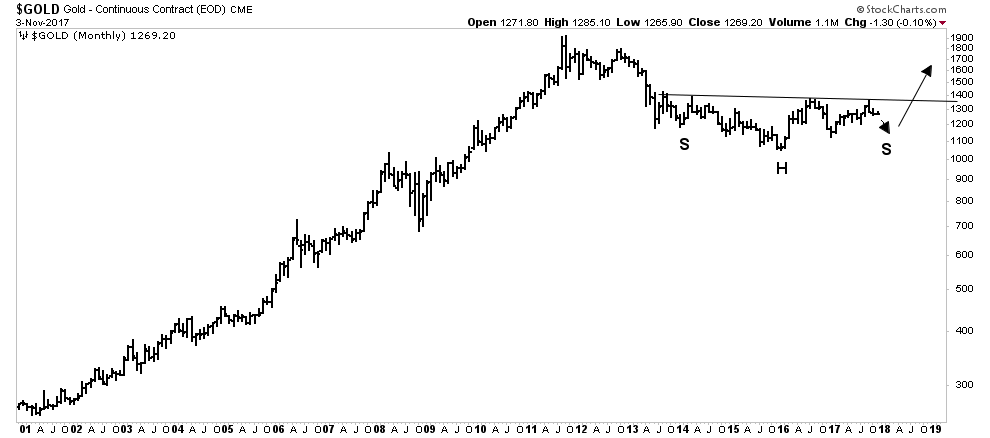
Gold Big Picture
Gold is still hanging in there above the down channel even in USD terms but it is clearly at a critical juncture. If it can resume its uptrend from here that would be very bullish, however stochastics point lower indicating it is set-up to violate the downtrend channel to the downside. Watch this chart closely
This view is backed up by the below chart which shows gold in lock step with the inverse of the USD. Again this points to the likelihood of lower gold prices, given a rising USD.

The chart below shows that even if we break down from these levels it is not the end of the world, just a temporary set-back since gold all the way down to 1150 would still be considered basing action of the big saucer consolidation. Gold could be ready for prime time as soon as early 2018.
This is not what we want to see. An uptrend should show the gold stocks rising ahead of the metal.
The daily chart looks grim as well. Locked in its downtrend probing new lows, volume collapsing with all indicators headed down. What is going to turn it around?
Bottom Line On The Gold Stocks: Looks like we go lower into tax loss selling. This particularly could be accentuated if the general market continues higher with investors selling those gold stocks and redeploying it into the stock market. I call this the shiny object factor, drawing attention away from the PM stocks.
*********
share
share
share
share
share


