Where Is Support For Precious Metals Markets?


The gold miners have broken below their 2008 to 2014 support, while Silver is essentially trading at a six year low. Gold looks set to make a new monthly low and weekly low but has yet to break its daily low at $1140/oz. Barring a sudden short squeeze Gold could be hours or days away from cracking in the way silver and the miners have in recent weeks. The trend for the sector is obviously down and sentiment is following. However, the more important issue for long-term bulls is where the strong support for these markets is located.
The monthly candle charts of Silver and Gold are below. I’ll start with Silver. It is losing key support at $15/oz. The next key support levels are in the low $13s and low $12s. Moving to Gold, note that Gold appears to have lost $1180/oz which has been a key support level for two years. The monthly chart shows that the next strong support levels are $1040 and $1000.
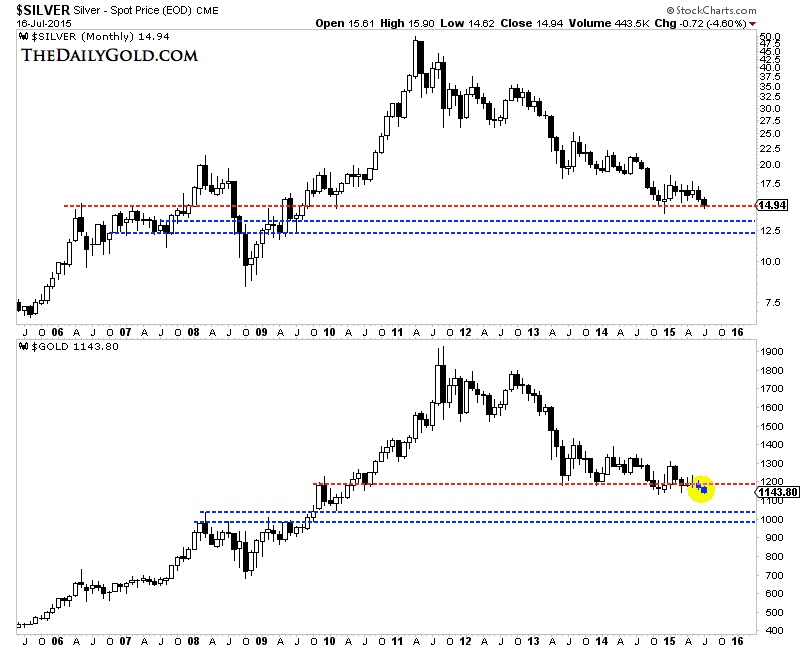
Silver & Gold Monthly
Moving on, let’s look at the miners. We plot $GDM (essentially GDX) and the HUI Gold Bugs Index. This time we look at the weekly line charts. The picture remains clear. GDM has broken below key support (the 2008 and 2014 lows) of 500. It has about 11% downside to the next strong support at 400. The HUI is a much weaker index as unlike GDM it is comprised only of miners and not the stronger royalty companies. The HUI still has a whopping 25% downside to its next major support.
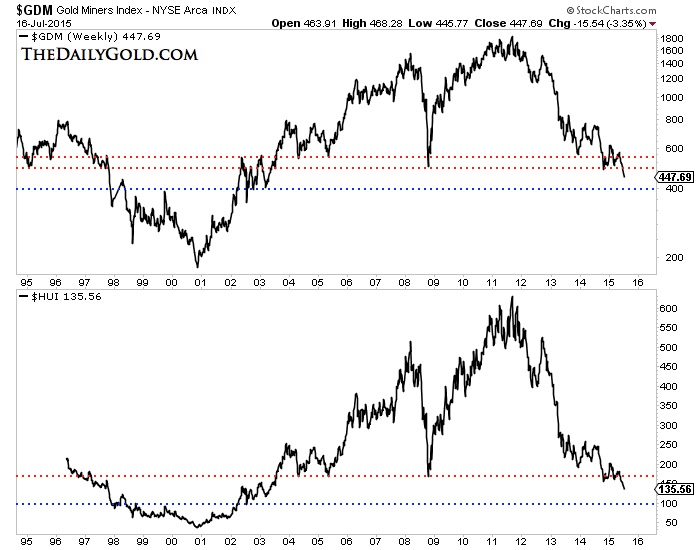
GDM (GDX) & HUI Weekly
GDXJ (not shown) is not performing as poorly as GDX and HUI because junior companies don’t have debt. In looking at the top five gold producers I found a combined market cap of roughly $40 Billion, $6.5 Billion in cash but $27 Billion in debt. Gold breaking below $1140 and $1100 could exacerbate the problems facing miners with significant debt. Hence, the GDXJ to GDX ratio should continue to rise.
The bear market in the miners is on the cusp of matching the 1996-2000 bear market. If the Barron’s Gold Mining Index drops another 10% then it will match the decline from 1996-2000. If the HUI drops to 100 it will match the decline from 1996-2000. If GDM, which closed Thursday at 448, drops 7% then it would match its decline from 1996-2000. You get the point.
The gold stocks bear analog chart below puts this bear market into perspective.
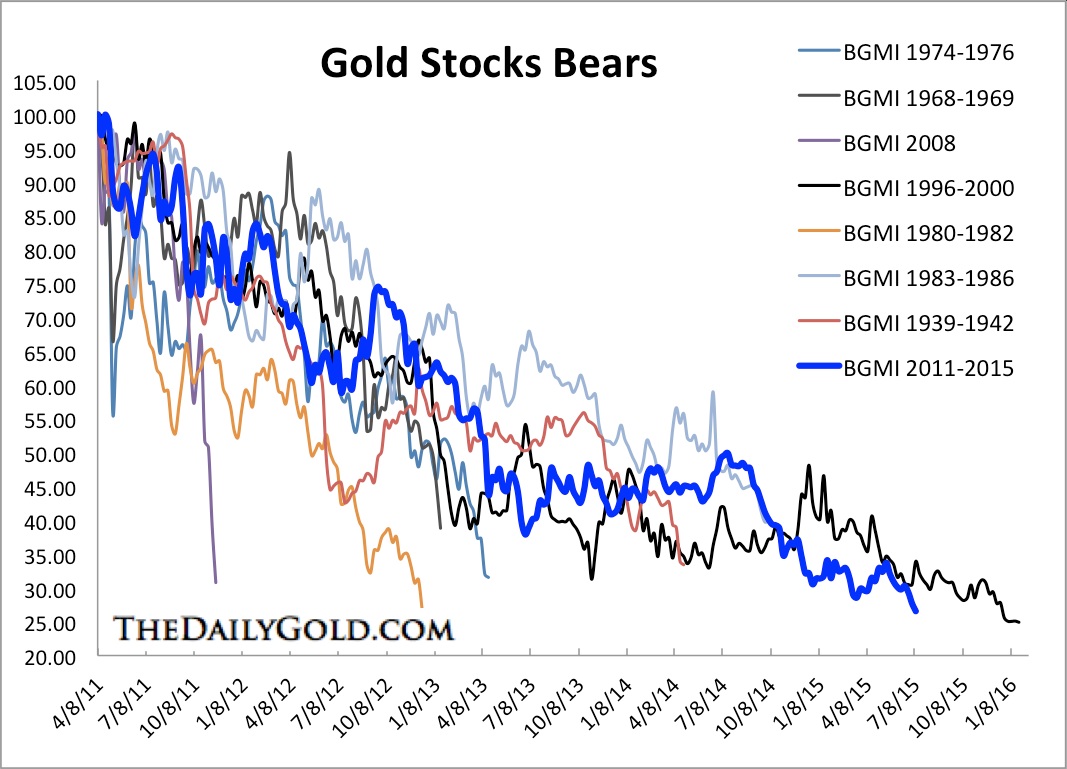
Barron’s Gold Mining Index Bear Markets
Considering the support targets, it is too soon to be a buyer. We’d prefer to see Gold below $1100 and Silver below $14 before thinking about buying. We will also keep the targets for GDM and the HUI in mind. If Gold cracks $1140 and $1100 immediately thereafter it is possible a mini capitulation could develop and the sector could rally. In our view the bottom is likely to develop over a few months rather than a few days or weeks. Stay defensive and stay nimble with hedges and short positions. At some point within a few months, the switch will flip and we could have some epic buying opportunities in the precious metals complex.
********
Jordan Roy-Byrne, CMT

Jordan Roy-Byrne, CMT is a Chartered Market Technician and member of the Market Technicians Association. He is the publisher and editor of TheDailyGold Premium, a publication which emphasizes market timing and stock selection, as well as TheDailyGold Global, an add-on service for subscribers which covers global capital markets. He is also the author of the 2015 book, The Coming Renewal of Gold’s Secular Bull Market which is available for free. TheDailyGold.com was recently named one of the top 50 Investment Blogs by DailyReckoning and WalletHub.


