Why Is Gold Becoming Scarcer


For quite a while, we have been talking about scarcity in gold. The cobasis for both October and December is positive. These contracts are backwardated. The cobasis for the February 2016 contract is not far from backwardation. The gold market is tight. Why? Let’s explore.
Part of the matter is that the price has fallen. The more the price drops, the more buyers tend to come out, and sellers go away.
We do not refer necessarily to the mines. Once the capital is sunk, a mining company is a price-taker. Management has little choice but to extract what it can, and hope the quantity produced times the profit available at a given gold price is enough to pay the fixed expenses such as debt service (well, if they don’t have a proper hedging program, which I wrote about here and here). Gold is often produced as a byproduct when mining for other metals, and this production depends on the profitability of the main metal in the ore.
For thousands of years, the market has absorbed all the output from every mine. If the quantity theory of money were true, gold would be a worthless commodity. Unlike everything else (except silver), the stocks of gold held by the people are a large multiple of annual production. There is no such thing as a glut in gold.
The lower price is not the only factor. The price of silver has fallen more than the price of gold. However, while there is backwardation in the September silver contract, there’s nothing even close in December much less 2016.
We constantly emphasize that gold does not go up or down. It’s the dollar that goes down or up, respectively. It’s mostly down, from over 1500mg gold in 1913 to just under 28mg today. This is an epic fall of more than 98% (though it’s up from around 16.5mg in 2011).
If it is controversial to say that gold doesn’t move, it’s even more so to say that the cause of the dollar’s decline is not its increasing quantity. The cause is its decreasing quality. In just the last 44 years since President Nixon’s gold default, the dollar fell from about 780mg. It is no coincidence that this dramatic drop occurred while the dollar went through several upheavals. The dollar was a gold redeemable currency, and then it was just a slice of the US government’s debt. Then the government spent more and more on less and less. After 2008, the dollar is partially a slice of mortgage debt, of unknown provenance.
It bloody well should be worth less! It represents less, claims less capital, and its likely repayment is dropping like a lead balloon.
That only leaves the question of why it has been rising for four years.
We think it boils down to confidence. Virtually everyone, from the blind faithful followers of the Fed, to its harshest critics, accept that the dollar is money. In other words, they are confident in the greatest confidence scheme ever.
In their view, gold goes up and down. This means: buy gold when it’s going up. And stay away, or even short it, when it’s going down. They have charts to tell them when this is occurring. And the fact is that gold has been going down for years. Few want to own a falling asset.
We use the metaphor of a Ouija Board frequently in discussing the gold market, or any market in which speculation is rampant. Everyone has a thumb on this little plastic piece, and it slides all over the board as if by magic. Well, it’s not magic. It’s just going wherever the mood of the group takes it.
The price of the dollar—of which the price of gold is just the inverse—goes here and there based on the mood of the crowd. Bigger crowd, same phenomenon.
Right now, the mainstream speculators who use futures see little reason to worry about the credit of the counterparties of their dollar deposits. Stocks and real estate (especially the kind of real estate favored by those who can buy or sell gold futures) are going up.
They also see little reason to buy gold as a hedge to inflation. If prices aren’t rising—and just ask the shale oil producers about the price of crude oil—then there’s doubly no reason to buy gold. At least, in the mainstream view.
At the same time that mainstream speculators don’t see it, those who are closer to these powder kegs do see something. Someone is buying gold metal, in preference to gold futures. Perhaps they see the coming trainwreck in $550B in shale oil junk bonds. Perhaps they see Spain going Greek. Perhaps they see wholesale bankruptcies coming in China. They are either buying gold metal, or at least not selling it.
The basis and cobasis are extraordinarily sensitive metrics. There isn’t a wholesale divorce between paper gold and phyz. The spread for the December contract is currently one third of one percent annualized. Still, it shows a sentiment disparity between speculators and stackers—the rest of humanity—who own the metal itself.
We have a bizarre environment. The speculators’ favorite assets are relentlessly rising. At the same time, the quality of credit is falling across many sectors and geographies. So long as the stock market holds, then credit doesn’t matter to the speculator. However, when a wave of credit defaults occurs, it will suck the liquidity out of the markets, cause spending and hence revenues to drop, and reverse the direction of both stocks and the dollar.
We should emphasize that we are making educated guesses about confidence and speculator sentiment. We are filling in some blanks. It’s possible that the above is not 100% right. However, we are certain of four things.
One, the bid price on gold metal is higher than the ask price on gold futures. Two, this should not be able to occur, and that it does means the market is tight. Three, there is an ever-changing dynamic between hoarders, speculators, arbitragers, producers, and manufacturers. Four, the market price of gold is below the fundamental price (i.e. the dollar is overpriced).
This week, the prices of the metals rose, $21 and $0.41 respectively.
Read on for the only accurate picture of the supply and demand conditions in the gold and silver markets, based on the basis and cobasis.
First, here is the graph of the metals’ prices.
The Prices of Gold and Silver
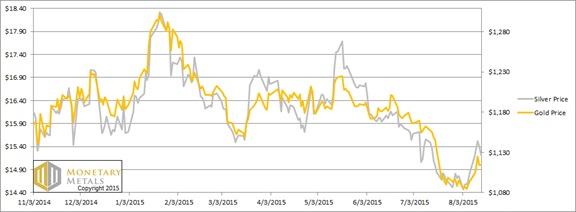
We are interested in the changing equilibrium created when some market participants are accumulating hoards and others are dishoarding. Of course, what makes it exciting is that speculators can (temporarily) exaggerate or fight against the trend. The speculators are often acting on rumors, technical analysis, or partial data about flows into or out of one corner of the market. That kind of information can’t tell them whether the globe, on net, is hoarding or dishoarding.
One could point out that gold does not, on net, go into or out of anything. Yes, that is true. But it can come out of hoards and into carry trades. That is what we study. The gold basis tells us about this dynamic.
Conventional techniques for analyzing supply and demand are inapplicable to gold and silver, because the monetary metals have such high inventories. In normal commodities, inventories divided by annual production (stocks to flows) can be measured in months. The world just does not keep much inventory in wheat or oil.
With gold and silver, stocks to flows is measured in decades. Every ounce of those massive stockpiles is potential supply. Everyone on the planet is potential demand. At the right price, and under the right conditions. Looking at incremental changes in mine output or electronic manufacturing is not helpful to predict the future prices of the metals. For an introduction and guide to our concepts and theory, click here.
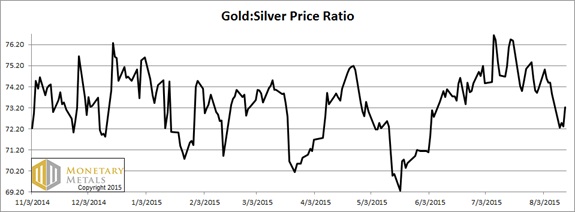
Next, this is a graph of the gold price measured in silver, otherwise known as the gold to silver ratio. The ratio moved down this week. It had been quite a bit lower, but moved up sharply on Friday.
The Ratio of the Gold Price to the Silver Price
For each metal, we will look at a graph of the basis and cobasis overlaid with the price of the dollar in terms of the respective metal. It will make it easier to provide brief commentary. The dollar will be represented in green, the basis in blue and cobasis in red.
Here is the gold graph.
The Gold Basis and Cobasis and the Dollar Price
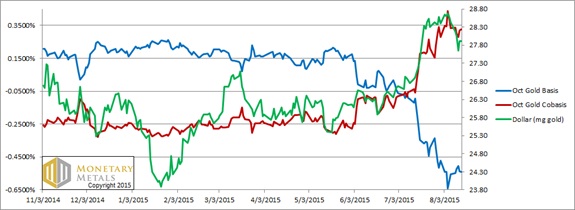
The price of the dollar dropped (i.e. the price of gold rose). However, the cobasis ended a hair higher than it was last week.
Let’s look at a new type of chart. It fits with our major themes: (A) the value of gold does not change, and indeed value is measured in gold the way length is measured in meters, (B) the market price of the dollar, which is just the inverse the commonly quoted price of gold, does move, and (C) the fundamental price of gold, which is just the inverse of the value of the dollar, moves independently of the market price.
We would love your feedback on this graph. It does not show price at all, but the discount (green) or premium (red, not shown as this has not occurred in gold in recent months) available on gold in the market.
A higher value, depicted as a deeper green, shows that gold is being sold at a larger discount to its value (i.e. the market will buy dollars at a premium). A value below zero indicates gold is selling at a premium.
The goal should be to accumulate gold at a discount, but avoid it when it’s trading at a premium (we always emphasize that one should NEVER NAKED SHORT A MONETARY METAL! You never know what some mad central banker will do while you are sleeping, and you could wake up to a 5% or 10% spike).
The Gold Discount

Now let’s look at silver.
The Silver Basis and Cobasis and the Dollar Price
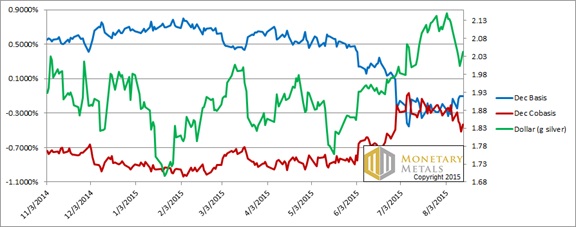
The price of silver went up. However, unlike in gold, the cobasis (i.e. scarcity) fell.
The Silver Discount
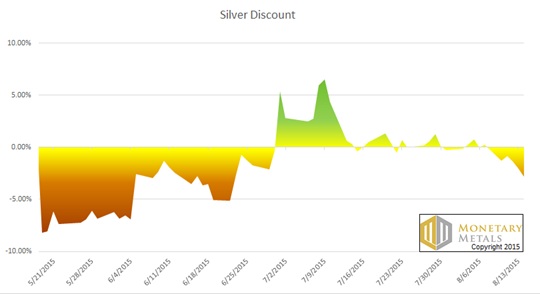
The silver discount chart looks radically different than the one for gold. There’s little bargain to be had—yes even at today’s price.
Silver is not only more volatile in its price, but also in its supply and demand fundamentals. Buyers came out for silver metal in the first few weeks of July, but then withdrew again. Now, with the rising price, it’s just a rising premium.
Gold measures the value of all things including the dollar and including silver. By contrast, the value of silver does go up and down. Not only are there speculators, but there are also industrial users. Not all silver that’s used in manufacturing is recycled. Therefore, a manufacturing downturn can press the value (and price) of silver.
********
Please drop us an email or comment, and let us know what you think of this new type of chart. Thank you! :)
Monetary Metals will be in New York City on Friday afternoon, September 11. You are cordially invited to join us for a discussion of the dollar, the interest rate, gold, and investing. Midtown. RSVP here.
© 2015 Monetary Metals
 Dr. Keith Weiner is the CEO of Monetary Metals and the president of the Gold Standard Institute USA. Keith is a leading authority in the areas of gold, money, and credit and has made important contributions to the development of trading techniques founded upon the analysis of bid-ask spreads. Keith is a sought after speaker and regularly writes on economics. He is an Objectivist, and has his PhD from the New Austrian School of Economics. His website is www.monetary-metals.com.


