Why No One Retires On $120 A Month Anymore


I like watching the old B&W programing from the golden age of TV; shows from the late 1940s to the early 1960s. It’s amazing how many financial concerns one generation shares with another. I got the following from the 1950s George Burns and Gracie Allen Show:
“The real problem with retiring is money. Most people save their whole lives to retire in the same style they enjoyed when they were working, only to realize that they can’t live like they used too even while they’re still working. You see these ads for retirement and they always have fishing boats in the background. That is because for $120 a month, fishing is the only way retired people can feed themselves.
- George Burns: George Burns and Gracie Allen Show, Season 8/Episode 9, 1957
Retiring on $120 a month? George Burns saw it as a problem, but doable in 1957 as did his audience. I suspect $120 a month ten years earlier in 1947 provided a comfortable, if not an extravagant retirement, but I can guarantee you that by 1967 living on only $120 a month was living in great hardship for retired people, if not impossible. What happened? The US Congress was inflating the money supply to buy votes, so over time the dollar lost its purchasing power. Government subsidized mortgages were a great source of inflationary pressures in the 1950s. And just as they were in the 1950s politicians today are subsidizing the mortgage market to keep the voters happy.
“The Housing Act of 1954 will turn out to be one of the worst pieces of inflationary legislation ever placed on the statute-books. For the first time, non- veterans will be able to buy a $10,000 house with a down payment of $500, the Federal Housing Administration insuring a 30-year mortgage of $9,500 on such a house. This is a triumph of the Nation’s Home Builder’s Association and a defeat of commonsense. Unfortunately, there is no reason to hope that mortgage money lenders will resist the practical consequences of this legislative monstrosity. Throughout the’ first half of’ 1954, most of them have been eager to make VA mortgage loans to home-buyers at no down payment at all.”
- Barron’s The World at Work, 05 July 1954, Page 7
No doubt the “legislative monstrosity” from 1954 was in part responsible for the situation that made George Burn’s joke on retiring pertinent in 1957. We can see exactly what Washington did to create inflationary price increases in the chart below; politicians keep using monetary inflation to fund government spending programs that keep the voters happy. In the chart’s insert covering 1925 to 1977, it’s obvious that by 1958 Washington’s monetary printing presses (Blue Plot) created a run on the US Treasury’s gold reserves (Red Plot) that did not end until August 1971 when President Nixon terminated the dollar’s last link to the Bretton Woods’ $35 gold peg. But as we see in the chart below, using data provided by the Federal Government itself, published by Barron’s going back to the 1920s, every president from Eisenhower to Nixon (and Congress) were part of the problem that led up to the August 1971 termination of the gold standard.
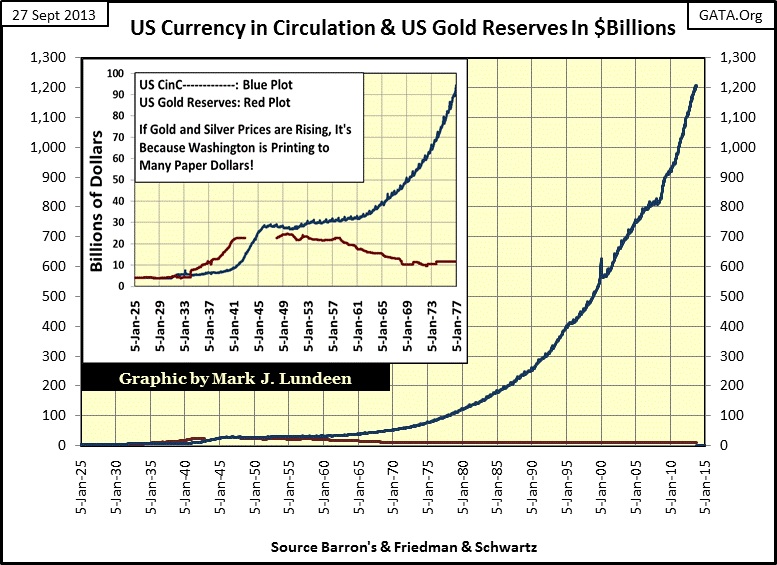
In the chart’s main area above, we see these two data series brought up to date. The US gold reserves are approximately unchanged since 1971, while the volume of paper dollars in circulation has increased from 59 billion to 1,205 billion dollars. Since 1971, that’s a twenty fold increase in CinC. If you wonder why homes costing $10,000 in 1954 were reselling for over $200,000 in 2007, it’s because politicians have promoted “home ownership” via monetary inflation in the mortgage market for a very long time, and they still are in 2013. Rising prices happens all the time with government subsidy programs, creating boom bust cycles in the economy. Before Congress created legislation for the school loan program, there was no college tuition crisis. I’m not saying that a college education was ever cheap, but long ago people could receive an excellent education by working their way through college. If college graduates today are leaving college loaded to their gills with debt from school loans, it’s because the college system, not their students, has been a great beneficiary of political largess.
Inflationary dollar increases in CinC are created when school loans are written by banks in our fraction reserve banking system; exactly as inflationary dollars are created when writing mortgages. Eventually these inflationary dollars circulate in the economy creating additional demand for goods and services which over time causes price increases. This is how inflation is created when bank loan creation is unchecked by a gold standard. Most people's understanding of inflationary price pressures is measured by the government’s CPI index; which is usually expressed in annual percentages. For myself, I ignore CPI and focus on the expanding number of dollars in circulation (CinC), and look at price increases from old-time television programs or compare advertised prices for goods and services published in daily newspapers from decades ago to our current day. When viewing inflation this way,(which is how it should be viewed) it becomes obvious that the United States has a huge monetary inflation problem that goes back many decades.
The only area in the economy that has resisted rising prices has been those areas of the economy where digital technology has taken hold. Computers and digital equipment only gets cheaper and more affordable, which has made manufacturing (foreign and domestic) more productive and cost effective. High-tech is responsible for a quantum leap in consumer goods’ design and in the quality of the products and services themselves. In the process, digital technology has kept consumer prices low in an inflationary era. In fact this high-tech increase in quality sometimes occurs with falling prices, but this is never so for those areas of the economy where the Federal Government has come to dominate. For example the health-care industry is heavily dependent on digital technology, yet its costs have sky rocketed due to government regulations, court costs and malpractice insurance price increases. Obamacare will do nothing to reverse rising healthcare costs, it will only increase them.
Economic opinion today is almost universal in denouncing the $35 an ounce gold standard as being the source of many problems the currency markets and the economy had in the post-World War Two world. But looking at the government’s own data above, it’s clear that most of these problems, like inflated home prices and cost of living issues for retired people, were the result of Washington issuing paper dollars far in excess to what the US Treasury had gold to back. An important thing to understand is that the gold standard by design restricts the growth of government, while it supported the growth of free enterprise. The gold standard was terminated because since FDR, free enterprise began to be identified as a major problem in society, while growing government regulations, managed by an expensive bureaucracy staffed with people hostile to business was seen as the solution to free enterprise. However, BIG government takes more money (inflation) than the gold standard will allow. As academic economic research is mostly funded by the government, frequently by the Federal Reserve, it’s not surprising the gold standard has been blamed for the economic difficulties caused by BIG government funded with monetary inflation.
Strange things are happening in today’s financial markets. It used to be an economic reality that any nation inflating its money supply was punished with rising interest rates. As the evidence below shows, that was certainly the case for the United States from 1955 to 1981. These yields may be for corporate bonds, but they were bonds payable in the same US dollars Washington was trashing with its inflationary monetary policy. After 1946, bond buyers began demanding an inflation premium to compensate them for the chronic loss of purchasing power investment principal was suffering when invested in the US bond market.
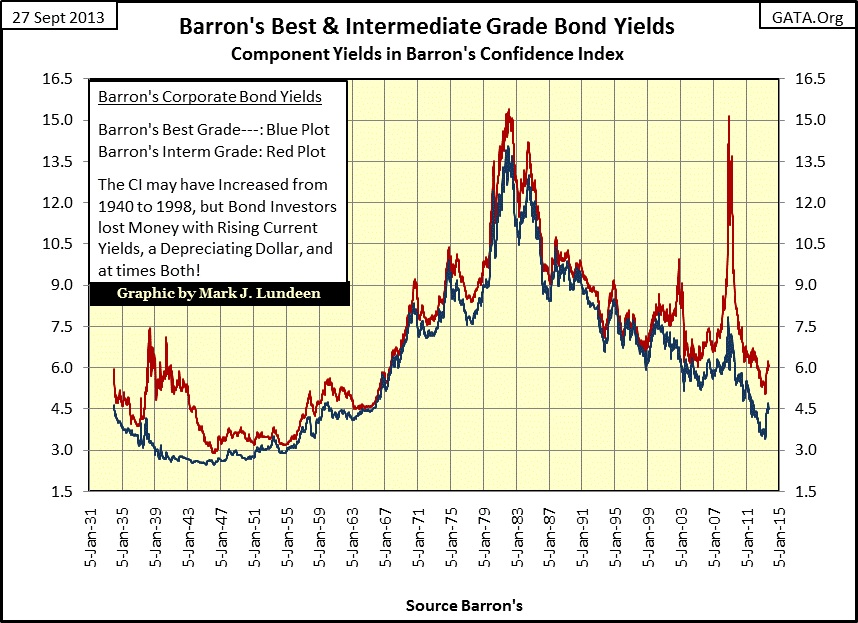
George Burns was exactly right when in 1957 he said that the real problem with retiring is the money. From 1957 to 1967, bond yields almost doubled even for best grade bonds (Blue Plot). Any retired couple who invested in “safe-conservative” bonds for income in 1957 saw their original principle cut in half in the next ten years. As bonds are “fixed income” there is never an increase in payment from the bond market to compensate investors for shrinking principle, or rising consumer prices. Investing in bonds priced in an inflating currency is a losing proposition. With bond yields rising to 6% in 1967, the $120 a month retirement plan became as extinct as the dinosaurs just ten years after 1957.
But then there is social security, which in 1967 made all the difference. However it was in the 1960s when President Johnson began a practice that continues to this day; using the social-security trust funds for funding current spending of the government’s growing bureaucracy. In return the Social-Security System receives a non-negotiable Treasury bond that is specifically issued for the Social-Security System. Being “non-negotiable”; what market could these trillions of dollars in reserves be sold in? How the Social-Security System plans to liquidate these many trillions of illiquid assets for cash when the coming waves of retiring baby-boomers begin to demand their monthly social security payments is a mystery to me. But then I don’t have a Ph.D. in Economics.
One thing's for sure; China isn’t going to buy any of them.
“We hate you guys. Once you start issuing $1 trillion-$2 trillion [$1,000bn-$2,000bn] . . .we know the dollar is going to depreciate, so we hate you guys but there is nothing much we can do.”
- Luo Ping, a director-general at the China Banking Regulatory Commission , 11 February 2009
But in 2013 I don’t believe the Obama Administration and Congress worries much about pending funding problems for social security, or the other social programs in the “social safety-net” the Democrats are so proud of. Since Obama became president, the US Government has not seen a proper budget passed by Congress. This failure suggests a certain lack of desire for running the national government in a businesslike manner. Not that it matters because thanks to the employment of “brilliant” academics by the Federal Reserve and the US Treasury’s top levels being staffed with financial “experts” from Wall Street, the political class in Washington, most of which are lawyers, can just do as they damn well please because all the money they demand magically appears with or without a budget. The sad truth is that even when there was a budget, accounting firms refused to render an opinion on the accounting maintained by the Federal Government, as government-financial operations are indecipherable. You just try that with the IRS and see what happens to you!
Returning to the bond yield chart above, incredibly from 2009-2012 bond yields collapsed in the aftermath of the greatest financial panic since the Great Depression. How does something like that happen? Sure, intermediary grade bond yields (Red Plot) spiked in 2002 and 2008, as they should have when Wall Street suffered from deflating asset prices. But after 2000, the yields for less than best grade bonds came down as fast, or faster than when they were up. During World War Two, that wasn’t how the corporate bond market worked.
You have to realize that bond prices go down as bond yields go up. From August 1937 to April 1938 (eight months), intermediate-grade bond holders lost half of their investment principle as yields for their bonds doubled. Market sentiment for intermediate-bonds was so devastated by this rise in yields that a decade passed before intermediary grade bond yields once again approached the yield of best grade bonds. However, our world today is totally different. Intermediate grade bonds can increase from 7% to 15% in one year (October 2007-08) and then decline from 15% to 7% the next (October 2008 – 09) with no public comment from market “experts.” These are not normal times. The bizarre 2007-09 rise and fall in intermediate grade bond yields is an undeniable indication of market manipulation by the Federal Government. And I think a warning to all bond holders of bad things to come when the Federal Reserve’s QE rig on the bond market comes undone. Free-market forces no longer hindered by “monetary policy” could cause bond yields to go double digit in a matter of months, and stay there.
Another indicator of pending disaster in the bond market is displayed in the chart below. I’ve plotted the ten-week moving averages of the indexed price of gold (Blue Plot/Left Scale) and the yield on the US Treasury’s long bond below (Red Plot/Right Scale).
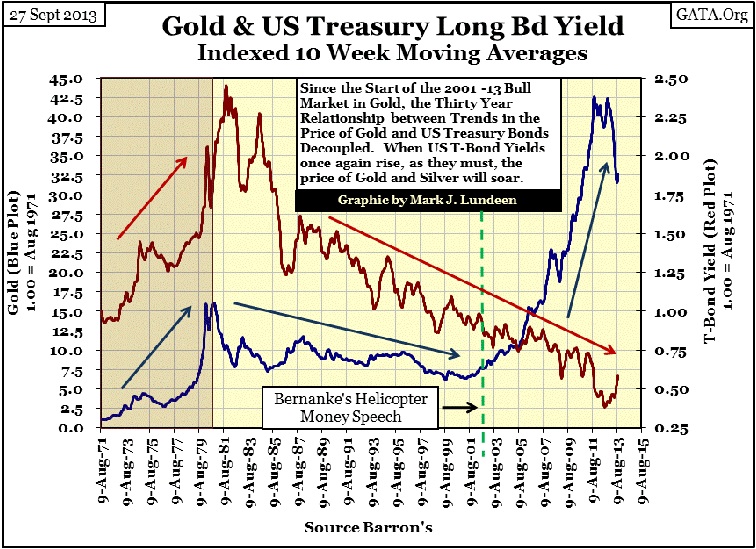
From 1971 to 2000, typically the price trend for gold was a leading indicator of future bond yields. This relationship between the price of gold and US T-bond yields isn’t bolted together, but from 1971 to 2001 (thirty years) it’s there. Then in 2001 as gold bottomed, and began a bull market that has lasted for the past twelve years, T-bond yields continued declining to levels far below those the market offered when the US Treasury defaulted on the Bretton Woods’ $35 an ounce gold standard in August 1971. Well, this is strangely logical. One of the goals of Doctor Bernanke’s quantitative easings is to create confidence in the bond market; a market that for good reason fears monetary inflation. The genius of Doctor Bernanke was to use massive monetary inflation (QE) to lower bond yields to those not seen since the US dollar was on the gold standard. This makes today’s contrived low bond yields an outrageous and dangerous lie. However “responsible” opinion makers are fine with this as this lie supports confidence in the financial system. I guess that is all that matters, at least for now.
The interesting fact about the timing of this decoupling of the price trend of gold to the US T-bond yields is that it occurred around the time Doctor Bernanke gave his helicopter-money speech in November 2002. The thesis of Doc Bernanke’s speech was that if a central bank was allowed to inflate a nation’s currency to sufficient levels, bear markets in financial assets could be prevented. Did Doctor Bernanke really believe that the bond-bull market that began in 1981 could be inflated forever? It seems that in November 2002 he did. Since Doctor Bernanke became Fed Chairman in March 2006 he’s been good to his word. But the recent talk of his early retirement from the Federal Reserve may be due to that he now understands what Austrian economists have said for over one hundred years; that there is no way to avoid an inflationary “crack-up boom”. Hard times are coming, and the Doctor may want to get the hell out of Dodge City before Mr Bear comes for his pound of flesh.
Back to gold and T-bond yields: what isn’t logical is seeing a concurrent bull market in the US Treasury market as the price of gold increased for the past twelve years. Rising T-bond prices (falling bond yields until July 2012) indicated that the financial markets were satisfied with Washington’s management of the economy and of the US dollar itself. But rising gold prices indicates just the opposite; that people are exiting the financial market for fear of what is coming to Wall Street. In the past decade someone has been wrong, and I don’t think it’s the people buying gold. Seeing T-bond yields reversing to the upside since July 2012 is a good indication that the bond market is also beginning to lose faith in the Federal Reserve’s ability to manage future market prices with its QE programs.
The current decline in gold looks bad, but every long-term bull market sees significant price corrections. What looks really bad is that since July of 2012, thirty-one years after the start of the bond-bull market, the Treasury’s long bond yield’s 10 Week Moving average has turned up by a significant measure. The yield’s 10 Wk M/A has almost doubled in the face of Doctor Bernanke’s third massive QE program which supports T-bond prices via direct purchases of T-bonds by the Federal Reserve. This reversal in bond yields for both the US Treasury and corporate bonds occurred about nine months after the current decline in the price of gold began. That is close enough to believe there is a connection between these two markets; that both markets are manipulated by Wall Street and Washington “policy makers.” Seeing the price of gold decline as bond yields have risen for over a year is yet another market anomaly in the financial market place.
Like the $120 a month retirement plan of 1957, the days of Doctor Bernanke’s QE to Infinity are numbered and for the same reason, monetary inflation flowing from the Federal Reserve is going to kill it. But for the Federal Reserve’s QE, its death will be a case of monetary suicide. If the price of gold and silver are at prices not seen in the past few years, thank the market riggers for the favor and do what the Asian central banks are doing and buy as much metal you can afford. A day is coming when you will be glad you did.


