Why A Period Of Consolidation Is Good For Gold


The rather sharp drop in gold late last week, especially on Friday, came as something as a shock to many investors in the sector, yet as we will proceed to see it was set up to react back here or soon, and a period of consolidation or reaction at around this level will actually put it in a better technical condition to mount a sustainable breakout above the key $1400 level.
On its latest 7-month chart the first point to observe is that gold is still well within our parabolic uptrend, whose lower boundary is coming into play and providing support, as is the rising 50-day moving average, with additional support being generated by premature sellers in the small Pennant pattern that formed during the first half of January. This is why it closed well off the lows on Friday, and why it could now resume the upward path again soon, and here's the point—even if it doesn't and instead breaks down from the parabolic uptrend, which the sizable drop on strong volume on Friday certainly makes possible, it will not be the "end of the world" for gold, and we will see why that is on our next chart.

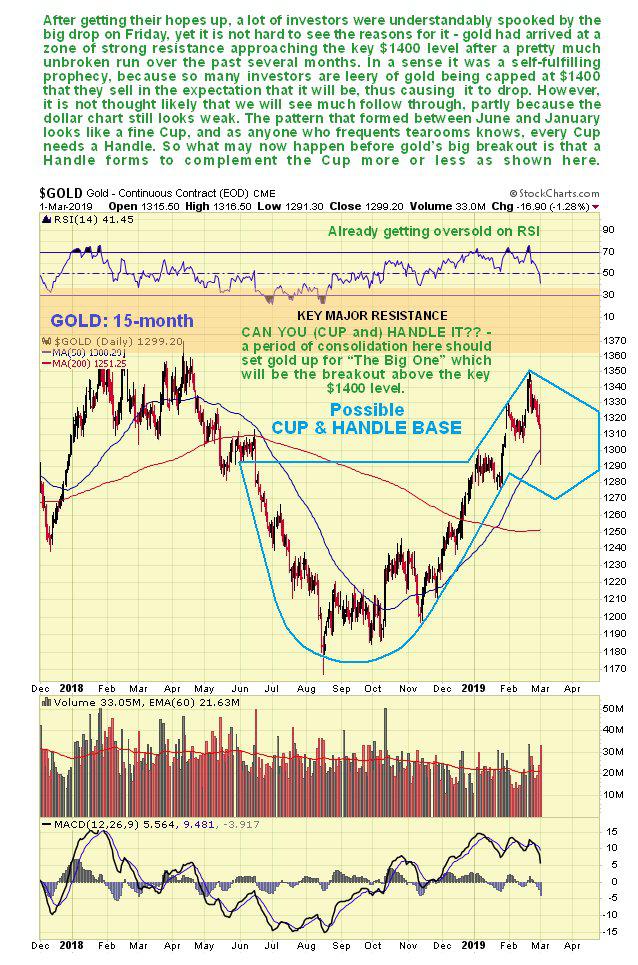
On the 15-month chart we can see why a period or consolidation/reaction here is actually good for gold, and will put it in better shape to break above the resistance approaching and at the $1400 level. This is because the accelerating run-up in gold since November resulted in it closing on this strong resistance in an overbought state, and it would be better if this unwound before it makes a determined attempt to "cross the great water." Thus it is very interesting to observe that the pattern that has formed in gold since last summer is a rather fine Cup, and as any tearoom devotee would say "What is a Cup without a Handle?," and when a Cup like this forms on the charts, it is very often followed by a complementary Handle that sets it up to break above the resistance at the upper boundary of the entire pattern into a major bull market. A prospective Handle area is shown that will doubtless require to be adjusted later, but serves to give us a rough idea regarding how long gold will need to consolidate before breakout can occur—by the look of it four to six weeks.
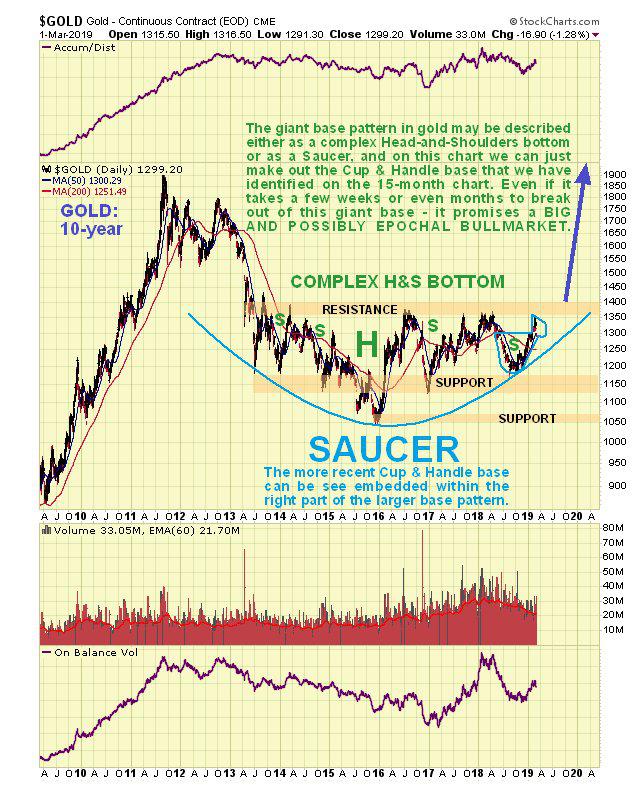
Lastly, we need to see how this prospective Cup & Handle base pattern fits into the larger base pattern that is approaching completion in gold. On the 10-year chart we can see that the Cup & Handle delineated on the 15-month chart is dwarfed by the much larger base pattern that can either be defined as a complex Head-and-Shoulders bottom or as a giant Saucer base. With the Saucer boundary now rising and closing steadily on the major resistance at the top of the pattern, it is clear that breakout must occur by about the end of the year at the very latest, and it is likely to occur much sooner than that.
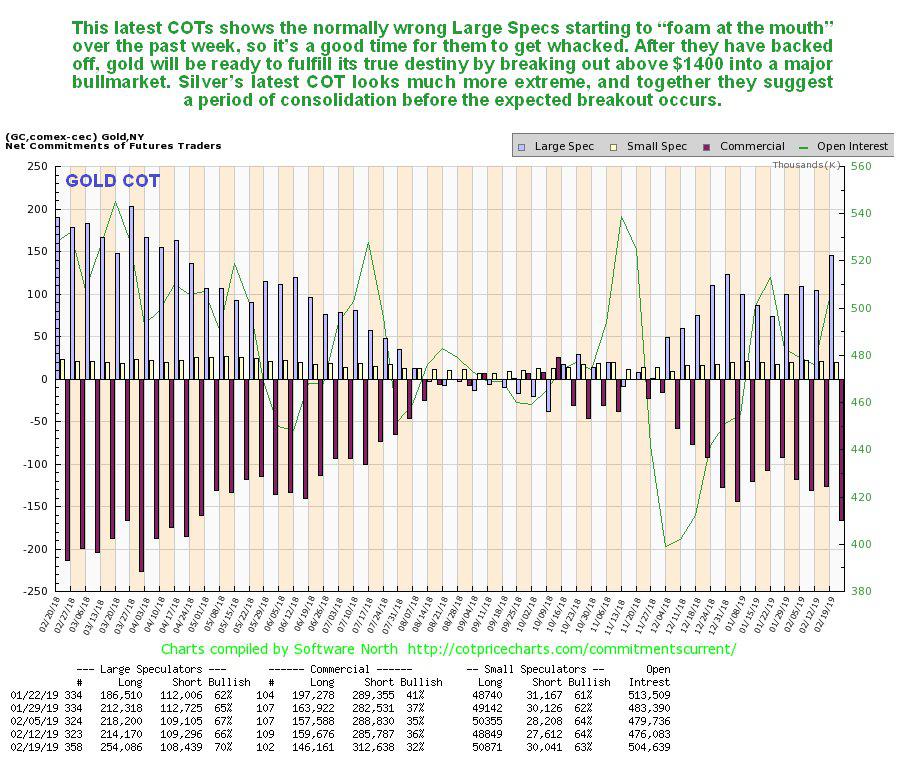
The latest gold COTs provided a valuable clue as to the increased likelihood of a near-term retreat, or rather they would if they were released in a timely manner, instead of three days late. They show that the Large Specs started to get very confident over the past week or two, and as they are normally wrong, that preceded the drop of the past three days. The more these positions moderate in coming weeks, the better will be the chances of gold mounting a sustainable breakout above $1400.
Click on chart to pop-up a larger, clearer version.
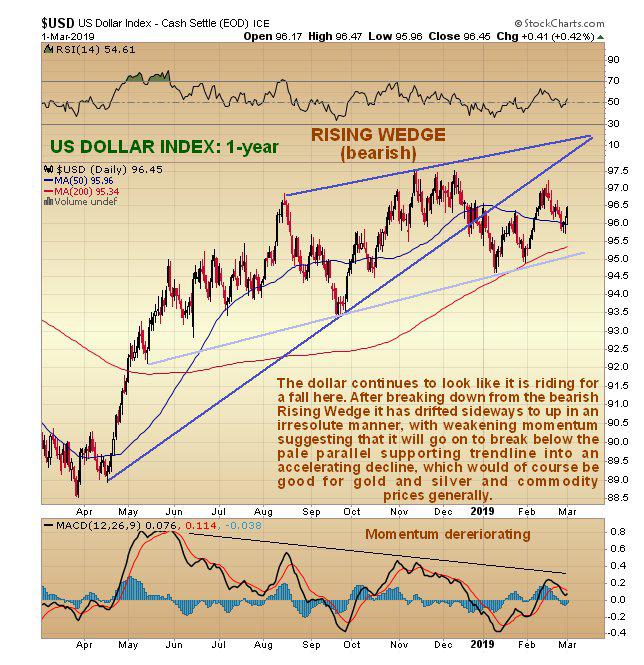
Finally, on its 1-year chart, the dollar index still looks like it is riding for a fall. Following its breakdown from a bearish Falling Wedge, it has staged a rather hesitant faltering rally which is not confirmed by momentum, which is relatively weak. This suggests that it will go on to break below the pale parallel supporting trendline shown, which would be expected to lead to an accelerating decline that would likely be the catalyst for gold breaking above $1400 into a new bull market.
Clive Maund has been president of www.clivemaund.com, a successful resource sector website, since its inception in 2003. He has 30 years' experience in technical analysis and has worked for banks, commodity brokers and stockbrokers in the City of London. He holds a Diploma in Technical Analysis from the UK Society of Technical Analysts.
Disclosure
1) Statements and opinions expressed are the opinions of Clive Maund and not of Streetwise Reports or its officers. Clive Maund is wholly responsible for the validity of the statements. Streetwise Reports was not involved in the content preparation. Clive Maund was not paid by Streetwise Reports LLC for this article. Streetwise Reports was not paid by the author to publish or syndicate this article.
2) This article does not constitute investment advice. Each reader is encouraged to consult with his or her individual financial professional and any action a reader takes as a result of information presented here is his or her own responsibility. By opening this page, each reader accepts and agrees to Streetwise Reports' terms of use and full legal disclaimer. This article is not a solicitation for investment. Streetwise Reports does not render general or specific investment advice and the information on Streetwise Reports should not be considered a recommendation to buy or sell any security. Streetwise Reports does not endorse or recommend the business, products, services or securities of any company mentioned on Streetwise Reports.
3) From time to time, Streetwise Reports LLC and its directors, officers, employees or members of their families, as well as persons interviewed for articles and interviews on the site, may have a long or short position in securities mentioned. Directors, officers, employees or members of their immediate families are prohibited from making purchases and/or sales of those securities in the open market or otherwise from the time of the interview or the decision to write an article until three business days after the publication of the interview or article. The foregoing prohibition does not apply to articles that in substance only restate previously published company releases.
Charts provided by the author.
CliveMaund.com Disclosure:
The above represents the opinion and analysis of Mr Maund, based on data available to him, at the time of writing. Mr. Maund's opinions are his own, and are not a recommendation or an offer to buy or sell securities. Mr. Maund is an independent analyst who receives no compensation of any kind from any groups, individuals or corporations mentioned in his reports. As trading and investing in any financial markets may involve serious risk of loss, Mr. Maund recommends that you consult with a qualified investment advisor, one licensed by appropriate regulatory agencies in your legal jurisdiction and do your own due diligence and research when making any kind of a transaction with financial ramifications. Although a qualified and experienced stock market analyst, Clive Maund is not a Registered Securities Advisor. Therefore Mr. Maund's opinions on the market and stocks can only be construed as a solicitation to buy and sell securities when they are subject to the prior approval and endorsement of a Registered Securities Advisor operating in accordance with the appropriate regulations in your area of jurisdiction.
********

Clive P. Maund’s interest in markets started when, as an aimless youth searching for direction in his mid-20’s, he inherited some money. Unfortunately it was not enough to live a utopian lifestyle as a playboy or retire very young. Therefore on the advice of his brother, he bought a load of British Petroleum stock, which promptly went up 20% in the space of a few weeks. Clive sold them at the top…which really fired his imagination. The prospect of being able to buy securities and sell them later at a higher price, and make money for doing little or no work was most attractive – and so the quest began, especially as he had been further stoked up by watching from the sidelines with a mixture of fascination and envy as fortunes were made in the roaring gold and silver bull market of the late 70’s.
Clive furthered his education in Technical Analysis or charting by ordering various good books from the US and by applying what he learned at work on an everyday basis. He also obtained the UK Society of Technical Analysts’ Diploma.
The years following 2005 saw the boom phase of the Gold and Silver bull market, until they peaked in late 2011. While there is ongoing debate about whether that was the final high, it is not believed to be because of the continuing global debasement of fiat currency. The bear market since 2011 is viewed as being very similar to the 2-year reaction in the mid-70’s, which was preceded by a powerful advance and was followed by a gigantic parabolic price ramp. Moreover, Precious Metals should come back into their own when the various asset bubbles elsewhere burst, which looks set to happen anytime soon.
Visit Clive at his website: CliveMaund.com


