Yield Curve Inverted Even More. Is It Finally Time For Buying Gold?
 share
share
 share
share
 share
share
 share
share
 share
share
The U.S. yield curve extended its inversion. Everyone and their brother knows that recession must definitely be on the horizon. We are all doomed, so gold can only go up now, right?
Yield Curve Inversion Gets Larger
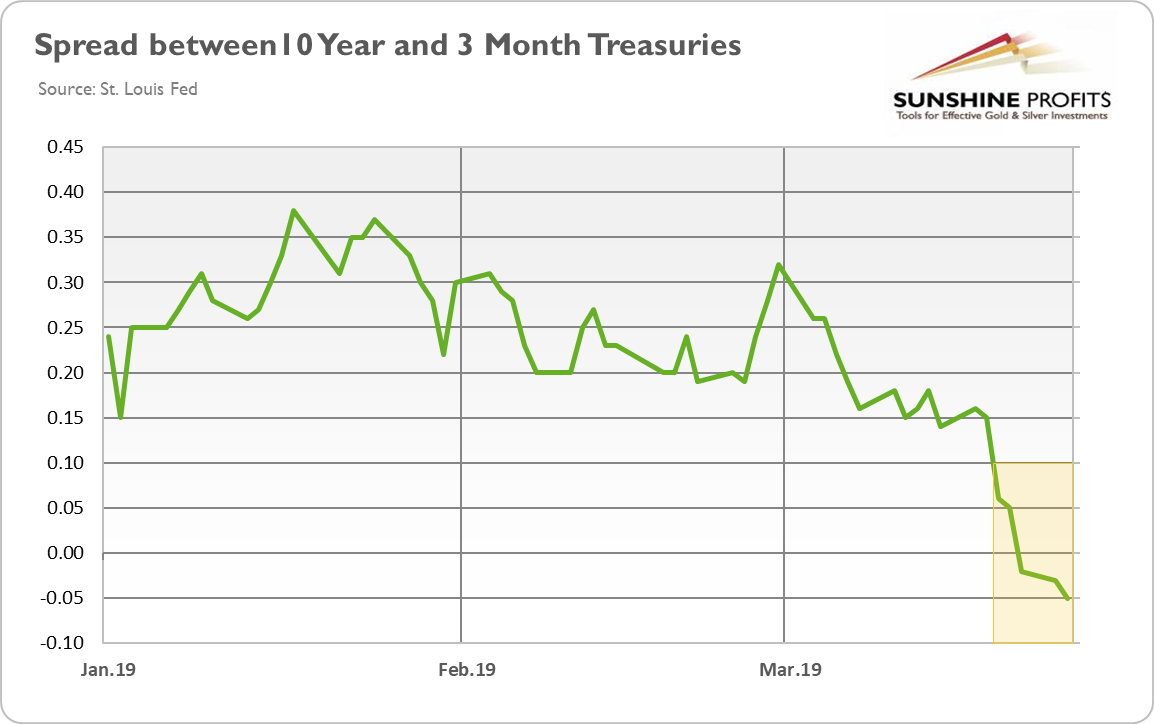
It’s getting more serious. On Friday, the yield curve inverted. This week, the spread between long-term and short-term rates has not only remained below zero, but it has dived further into negative territory. As the chart below shows, the difference between 10-year and 3-month Treasuries fell to -0.05 on Tuesday.
Chart 1: Spread between 10-Year Treasuries and 3-Month Treasuries from January 2019 to March 2019.
We are aware that many other interesting things are happening right now (take the fascinating Brexit saga, for instance), but the yield curve remains the hottest topic among investors with potentially enormous implications, so let’s continue our Tuesday’s deliberations and build on our analysis what the current inversion really means for the precious metals market.
To make a long story short, we are still not freaked out by the yield curve inversion and we urge gold investors to keep calm. Why? The key world is “macroeconomic context”. Let’s take a look at the chart below. It displays the yield curve and the unemployment rate, which is one of the most important macroeconomic gauges and recession indicators.
Chart 2: Yield curve (green line, left axis, spread between 10-year and 3-month Treasuries, in %) and the unemployment rate (red line, right axis, in %) from January 2000 to February 2019.

As one can clearly see, in two previous cases of the yield curve inversion, the unemployment rate was either flat or rising. But now, the unemployment rate does not send any evident recessionary signals which would make the gold bulls instantly happy. We can cite much more data that shows how the current condition of the American economy differs from the previous yield curve reversal. Actually, we have already done so in the March edition of the Market Overview. Here, we will present just one more chart, which shows the yield curve and the expected change in real income of households as calculated by the University of Michigan.
Chart 3: Yield curve (green line, left axis, spread between 10-year and 3-month Treasuries, in %) and the index of expected change in real income during the next year (red line, right axis) from January 2000 to January 2019.
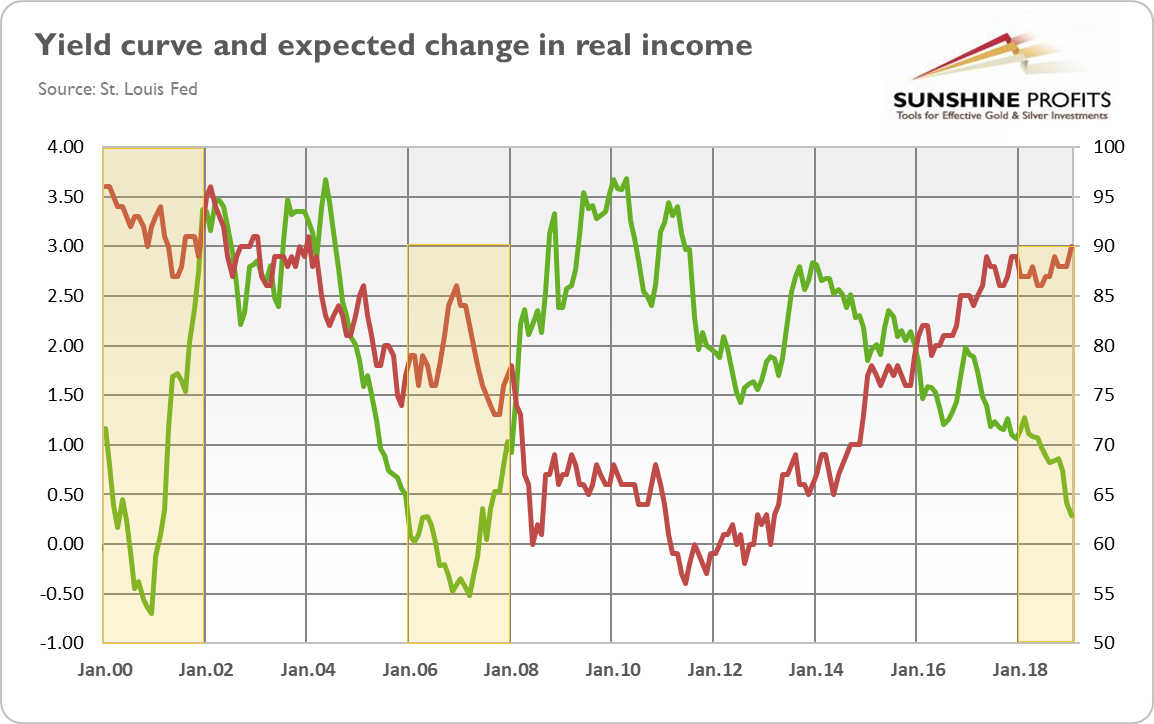
As one can see, after the previous yield curve inversion and right before the Great Recession, the index fell sharply. Now, the index has recently increased to the highest level since 2002. Our point is that, of course, we see some signs of weakness in the US economy, but not as many as in 2007/2008. It means that the recent yield curve is a disturbing signal, but it does not have to be the right signal.
Implications for Gold
The yield curve inversion and the heightened recession fears may support the gold prices. However, as the chart below shows, gold’s reaction has been hardly euphoric so far.
Chart 4. Gold price from March 26 to March 28, 2019
One reason might be that the recession may rear its ugly head rather in the Eurozone than in the US. Yesterday, Mario Draghi said that the European Central Bank could further delay an interest rate hike and look at measures to mitigate the side-effects of negative interest rates. So, the US dollar may remain the number one choice among investors, creating a downward pressure on the gold prices.
Another issue is the reason why the yield curve inverted. It did not happen because the Fed tried to stop the overheating of the economy and prevent the rise of inflation. Not at all, the US central bank is far from wanting to kill the expansion. It’s rather reloading the chamber so as to have standard monetary tools available with which to fight the next crisis when it appears. So it is not the case that the short-term borrowing costs have increased abruptly, hitting the entrepreneurs who have to scramble now for liquidity. No, as the chart below clearly shows, the yield curve inverted because the long-term bonds yield declined, which means that the market expects interest rates in ten years to be lower than they are at present.
Chart 5: 10-year Treasury yields (green line), 2-year Treasury yields (red line) and 3-month Treasury yields (blue line) from January to March 2019.
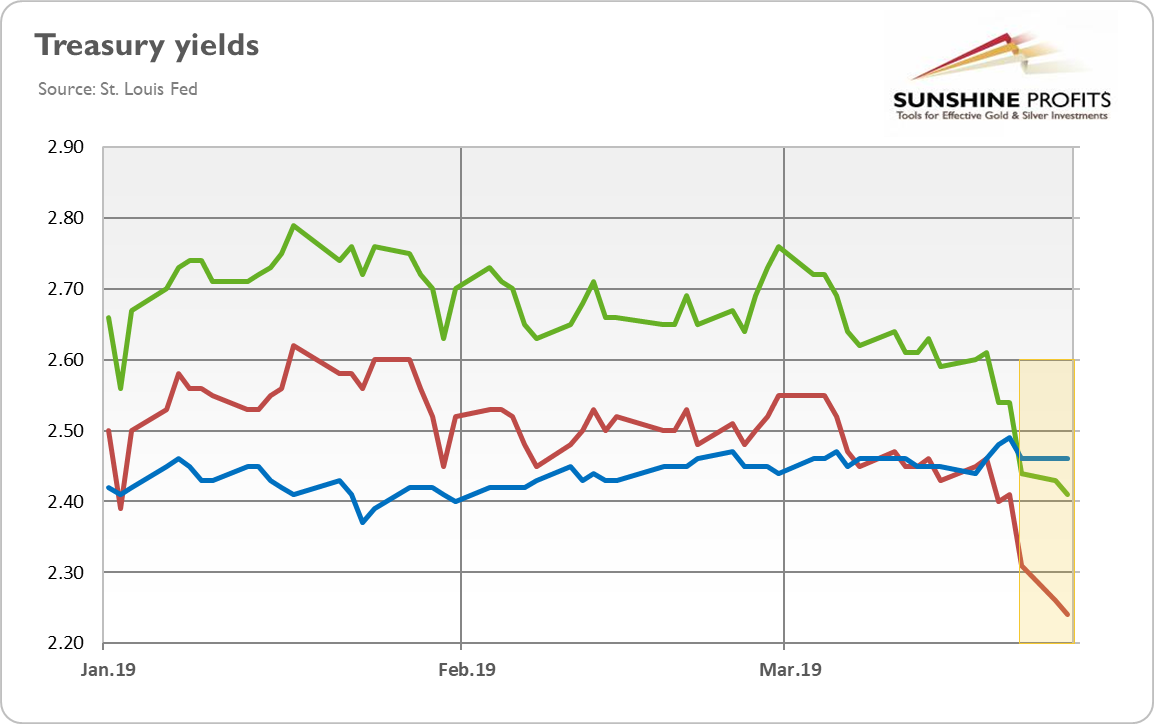
So, investors became more pessimistic. But, does it matter at all? After all, the current expansion is already the most hated expansion after the WWII. Last but not least, the chart above also indicates that the 10-year yields are still higher than 2-year rates, so only one type of spread has inverted so far (in contrast to previous pre-recessionary inversions). All this leads us to the conclusion that the fresh yield curve inversion does not necessarily signal the imminent recession (and if it does we still have about 12-18 months before it will arrive). Hence, although the more dovish Fed could be positive for the gold prices on the margin, the bulls will have to wait a little bit longer for the rally in the precious metals market.
If you enjoyed the above analysis, we invite you to check out our other services. We provide detailed fundamental analyses of the gold market in our monthly Market Overview reports and we provide daily Gold & Silver Trading Alerts with clear buy and sell signals. If you’re not ready to subscribe yet and are not on our gold mailing list yet, we urge you to sign up. It’s free and if you don’t like it, you can easily unsubscribe. Sign up today!
Disclaimer: Please note that the aim of the above analysis is to discuss the likely long-term impact of the featured phenomenon on the price of gold and this analysis does not indicate (nor does it aim to do so) whether gold is likely to move higher or lower in the short- or medium term. In order to determine the latter, many additional factors need to be considered (i.e. sentiment, chart patterns, cycles, indicators, ratios, self-similar patterns and more) and we are taking them into account (and discussing the short- and medium-term outlook) in our trading alerts.
Arkadiusz Sieron
Sunshine Profits‘ Gold News Monitor and Market Overview Editor
* * * * *
All essays, research and information found above represent analyses and opinions of Przemyslaw Radomski, CFA and Sunshine Profits' associates only. As such, it may prove wrong and be a subject to change without notice. Opinions and analyses were based on data available to authors of respective essays at the time of writing. Although the information provided above is based on careful research and sources that are believed to be accurate, Przemyslaw Radomski, CFA and his associates do not guarantee the accuracy or thoroughness of the data or information reported. The opinions published above are neither an offer nor a recommendation to purchase or sell any securities. Mr. Radomski is not a Registered Securities Advisor. By reading Przemyslaw Radomski's, CFA reports you fully agree that he will not be held responsible or liable for any decisions you make regarding any information provided in these reports. Investing, trading and speculation in any financial markets may involve high risk of loss. Przemyslaw Radomski, CFA, Sunshine Profits' employees and affiliates as well as members of their families may have a short or long position in any securities, including those mentioned in any of the reports or essays, and may make additional purchases and/or sales of those securities without notice.
share
share
share
share
share

Arkadiusz Sieroń received his Ph.D. in economics in 2016 (his doctoral thesis was about Cantillon effects), and has been an assistant professor at the Institute of Economic Sciences at the University of Wrocław since 2017. He is a board member of the Polish Mises Institute of Economic Education, author of several dozen scientific publications (including in such periodicals as the Journal of Risk Research, Prague Economic Papers, Quarterly Journal of Austrian Economics, and Research in Economics), and a regular contributor to GoldPriceForecast.com and SilverPriceForecast.com. His two books, Money, Inflation and Business Cycles and Monetary Policy after the Great Recession, are both published by Routledge. Arkadiusz is also a certified Investment Adviser, a long-time precious metals market enthusiast, and a free market advocate who believes in the power of peaceful and voluntary cooperation of people.