Gold Loses A Battle, But War Continues


Dow Arc Of Failure Chart
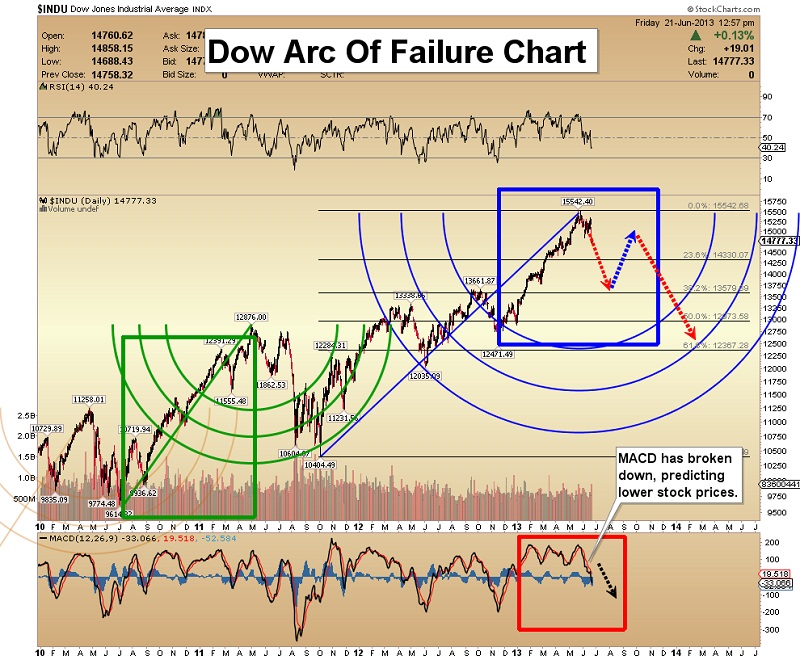
• The US market is resilient, and major market tops are built slowly.
• Distribution volume and the lack of leadership are significant now. The average investor is probably too optimistic at this stage of the market. Better opportunities lie ahead after a market correction.FXI (China Stock Market Proxy) Chart
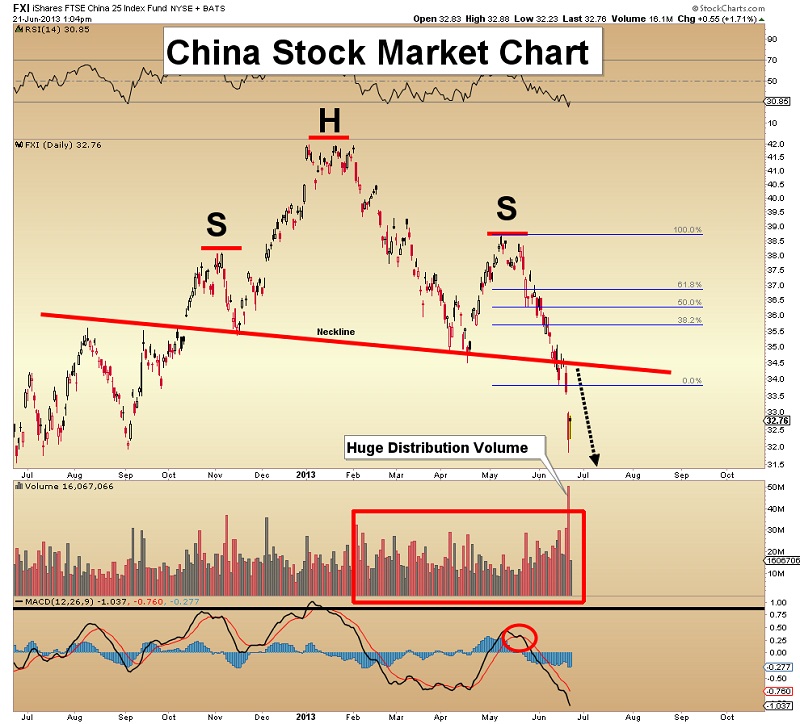
• China is significant, because it is the world’s largest manufacturing economy.
• FXI broke the neckline of a head & shoulders top pattern on Friday, which is ominous. Now, the market is almost free-falling. Watch the volume on any rally. I expect it to be feeble.
• My downside FXI target is $26.
Gold Cycle Chart
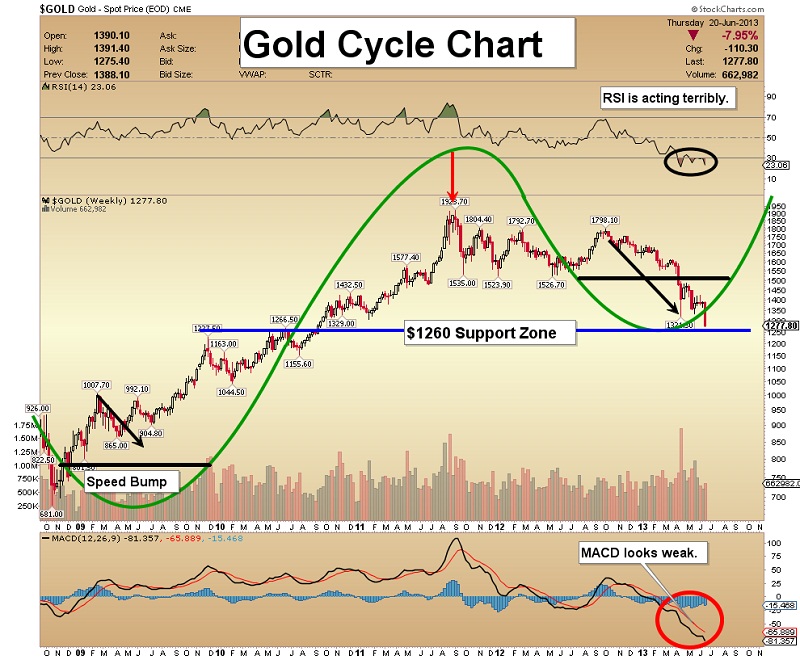
• I have stated here several times that the (trap) door is open for a move to $1260 or lower. If there is a move to that level, the “smart money” COT indicator should be quite bullish.
• Small speculator (“dumb money”) comex long positions are near 20 year lows.
• This cycle chart suggested there could be some kind of topping process in the $1700 - $2200 area, and it is now indicating that the $1000 - $1400 area is some sort of vague bottom. Cycles need to be considered in a very “loose” manner, but this one suggests gold does offer value to investors now.
• Note the RSI indicator; it is still under 30, and struggling. That’s bearish technical action, but value players should be buyers now.
• MACD showed some positive signs of reversing a week ago, but it’s already back into “bear mode”.
Gold Seasonal Chart
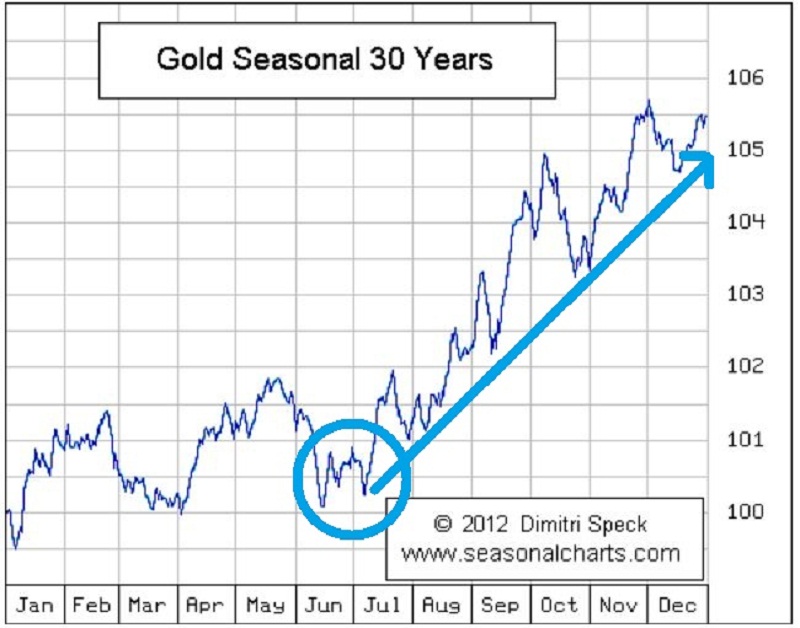
• This is a chart from Dimitri Speck. It shows the seasonal tendencies of gold, over the last 30 years.
• This could be a good year for seasonal chartists, but note the April period. Instead of a “seasonal rally”, gold experienced the worst crash in decades.
• The early summer is when gold typically rallies. The chart is bullish, but these seasonal patterns don’t come with a guarantee!
GDX Moment Of Truth Chart
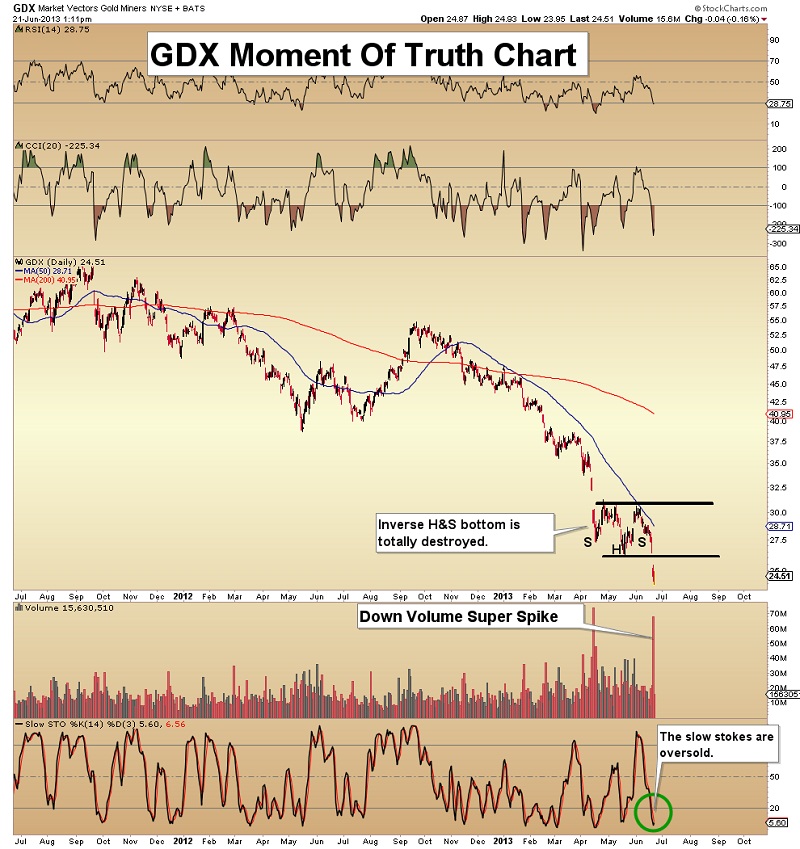
• A wave of panic selling has totally destroyed the small inverse head & shoulders pattern.
• The low of the head is at $26.24, and any rally is likely to stop there.
• It’s a disappointing time for bulls; another battle in the great gold war has been lost.
• My recommendation at times like this is to go into “safe mode”. Try to buy some of your favorite gold stocks, but keep the size very small.
GDXJ Junior Stock Destruction Chart
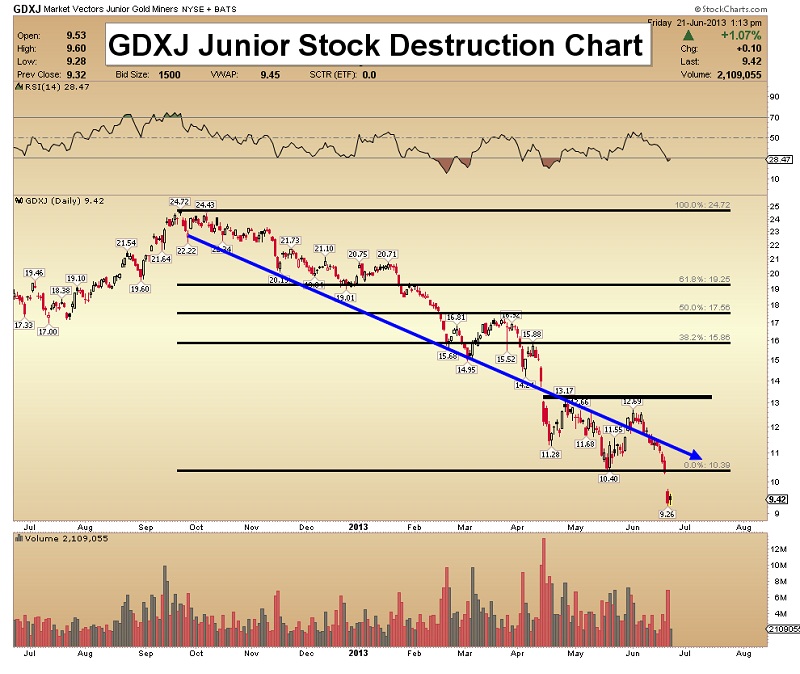
• Many individual junior stocks are trading “no bid”. An ETF like GDXJ can give investors a measure of confidence, because there is always good liquidity.
• I mentioned my concern that GDXJ could not stay above the blue trendline, and you can see that the price looks like it just dropped through a trap door.
• Investors need to wait for a new technical base formation to form, and then we’ll do battle with the bears again!
Silver Seasonal Chart
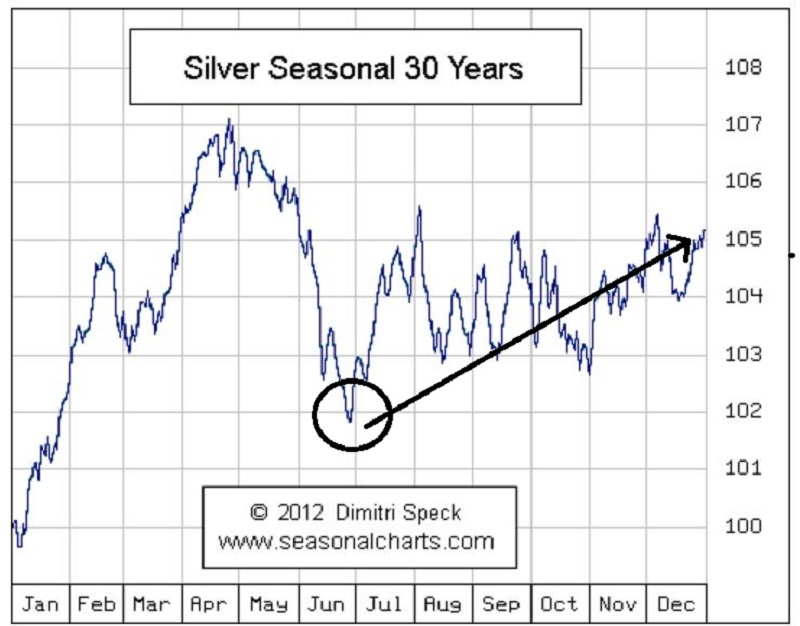
• Like gold, silver can bottom in June. Silver is much more volatile than gold, and the seasonal charts can be less reliable.
• Money management tactics are probably more important now than “calling the seasonal bottom”.
Silver Technical Danger Chart
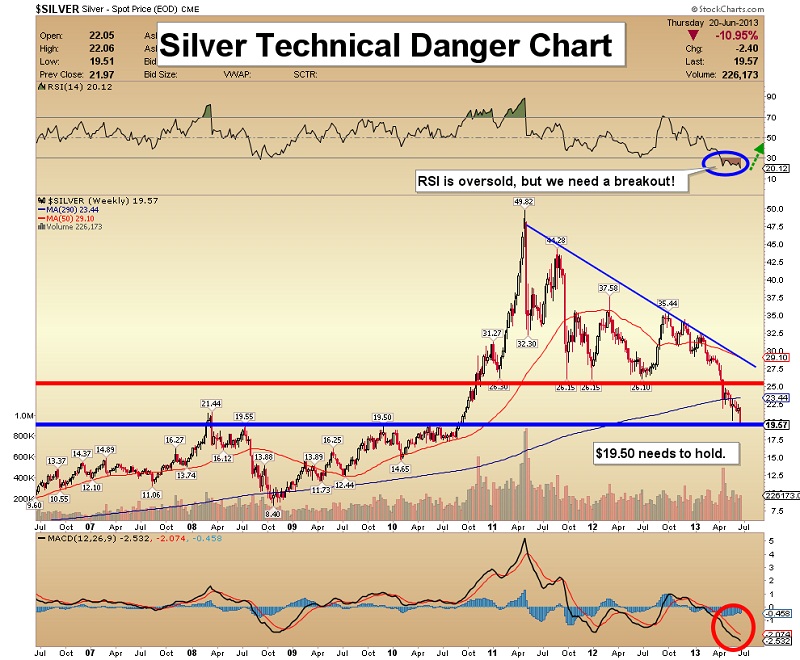
• Silver is testing long term support at $19.50, and that’s a concern. Weekly RSI is oversold, but it still can’t get over 30.
• I bought a little silver a week ago, but momentum traders should stay out of this market. MACD must not only turn higher, but show a crossover buy signal, or silver will continue to drift lower.
• $16.25 is the next key support zone on the downside, and I’m committed to buy more silver there. Silver bulls have lost a lot of battles recently, but not the war!
Unique Introduction For Gold-Eagle Readers: Send me an email to [email protected] and I'll send you 3 of my next Super Force Surge Signals, as I send them to paid subscribers, to you for free. Thank-you!
Stay alert for our Super Force alerts, sent by email to subscribers, for both the daily charts on Super Force Signals at www.superforcesignals.com and for the 60 minute charts at www.superforce60.com
About Super Force Signals:
Our Super Force signals are created thru our proprietary blend of the highest quality technical analysis and many years of successful business building. We are two business owners with excellent synergy. We understand risk and reward. Our subscribers are generally successful business owners, people like yourself with speculative funds, looking for serious management of your risk and reward in the market.
Frank Johnson: Executive Editor, Macro Risk Manager.
Morris Hubbartt: Chief Market Analyst, Trading Risk Specialist.
Super Force Signals
422 Richards Street
Vancouver, BC V6B 2Z4
Canada
More from Gold-Eagle


