2013...And Still Stuck On Stupid


The word I would use to describe this market is “tedious.” It seems that nothing truly exciting has occurred since the monetary metals, and the Dow Jones took their plunges in 2011. In our theatre-of-the-absurd called the financial markets, the holy grail of “policy” is “STABILITY”, and stability is boring. But nothing lasts forever. Don’t worry; there will be plenty of excitement in the months and years to come.
Here is my gold step sum chart. Since early October, gold, and its step sum have been trending down, until December when these plots began trending sideways with gold finding support at $1650.
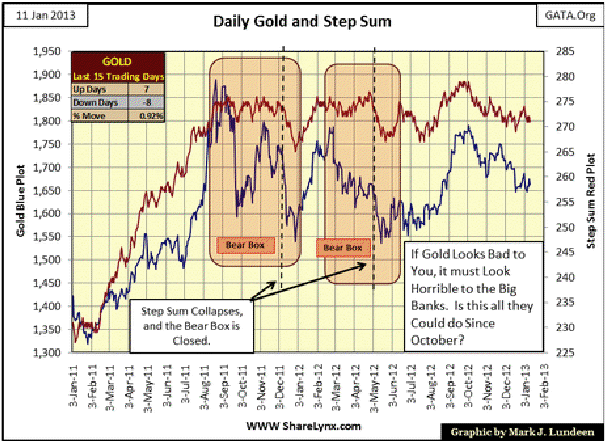
So, will the next big move be up or down? I don’t know, but the smart move in January 2013 is to either buy more gold or hold on to what you have. The smart money knows that during prolonged bull markets, the time to buy more is when there is a general lack of interest in the market, during boring periods like this. The time to sell is when a market takes off. It’s like they used to say; “when the ducks start quacking; feed them.”
In gold’s BEV chart (below) we see an inverted head & shoulders technical formation. Maybe the ducks will start quacking soon. Also remember, a Princeton man (a specialist in the Great Depression), is now controlling the money supply. Ultimately, that can only be bad for the dollar and good for gold and silver.

Silver too, has formed an inverted head & shoulders formation. This is no guarantee that the next major move for silver, or gold’s will be up. But if you study charts long enough, significant moves to the upside do originate from inverted head & shoulders formations like these we see above and below.
So Mark, what do you really think are the chances for a big move to the upside soon? Well, the global financial community is currently stuck-on-stupid. And stupid is precisely the correct term to describe anyone in January 2013 who holds US Treasury long bonds yielding only 2.91% by the billions. But maybe the US Treasury’s announcement that they are considering monetizing a $1500 platinum coin for a trillion digital Obama bucks will smarten them up. Obviously, Doctor Bernanke’s promise to monetize over $40 billion dollars of US Treasuries and worthless US mortgages a month didn’t do the job.
So far we haven’t seen these increases show up on the Federal Reserve’s balance sheet in the plots below. They soon will, and it will be damned embarrassing when the red and blue plots double again in three and a half years. It could be worse; the Fed “monetized” two trillion in US Treasury bonds (blue plot) from June 2008 to May 2010, while at the same time “monetizing” over $1.25 trillion in worthless mortgages (red plot) held by Wall Street banks.

Look at the “monetary stimulus” since 2008. The only thing Doctor Bernanke has stimulated is unemployment, and the Doc knows it too. Any talk from Washington about dealing with unemployment via “stimulus” is pure baloney, and the politicians know it. From the start, the Fed’s quantitative easings (painfully evident above) have always been to save the big banks on Wall Street and the public be damned. We are looking at nothing less than the murder of the US dollar, and after the deed is done, we won’t even get an “I’m sorry” from the Ivy-League idiot savants who inflated our money to extinction.
Let’s look at a few of the prime beneficiaries of the Fed’s QE programs; the precious metals and the stock markets. Charts can be deceptive, especially short-term charts, so let’s take a long-term view at gold, silver and the Dow Jones from the time the US Treasury “TEMPORARILY” defaulted on its gold obligations for the second time in the 20th century; August 1971.
I know the thirty Dow Jones companies are large dividend paying blue-chip companies. Still, I believe the venerable Dow Jones is a good proxy for the stock market. Gold and silver are only elemental metals on the periodic table, but for thousands of years they have been circulating as money – for good reason. This makes them a good proxy for measuring how much “faith and confidence” global commerce has in the US dollar: less and less since August 1971.
Of the three, the Dow Jones has done the poorest over the past five decades. An increase in the Dow Jones by a factor of fifteen may seem good, but the number of dollars in circulation (CinC) has increased by a factor of nineteen over the same time period. Looking at gold and silver since 1971, gold is the clear winner, appreciating at twice the rate of CinC inflation, while silver has been a break even investment. What about the Dow Jones’ total return with dividends? Well what about them? Depending on the income-tax bracket someone was in from FDR to Reagan (1932-1980), Uncle Sugar may have taken from 0% to 70% of investors’ dividend income, and the tax-bite whimsically changes every few years. I’ve seen charts showing the difference in appreciation of the S&P500 and Dow Jones with and without dividends. These people never show their work, or mention which tax bracket (if any) was used in computing their data. After taxes, I suspect dividend income has had little effect on the Dow Jones or S&P 500 total return.
But forty two years have passed since August 1971. A more useful view of these markets is to look what has happened since January 2000, at the top of the 1982-2000 stock-bull market. As you can see in the table below, the Dow Jones returns are far below the increase in dollars the Federal Reserve has placed into circulation, while gold and silver’s gains are clearly leveraged to Washington’s monetary follies. Why anyone is risking money in the stock market is beyond me.

The bullish primary trends for gold and silver are now firmly established, appreciating by some multiple to the increase in CinC. Currently it’s around 4.5 to 1, but I expect this multiple will increase dramatically once interest rates begin to rise, as one day they must. Foreign demand for US Treasury bonds will one day dry-up. Then Uncle Sam’s IOUs held overseas will return home, becoming another source of supply the Federal Reserve will have to “monetize” if the Federal Reserve want’s to keep US bond yields low. Currently the Fed holds about 16% of the US Treasury’s bond issued. When it approaches 30% of the US National Debt, I doubt current yields for bonds maturing in 2041 will be less than 3%! The full faith and credit of the US Government has a grim future.
The truth is that overseas central banks, insurance companies and pension fund managers are sick of Washington’s profligate spending, funded largely by the creation of ever more Treasury debt whose income at current yields does not compensate Washington’s creditors for inflation. The day is coming when the dirty four letter word – sell, will be shouted in the US Debt market in all twenty four time-zones. When this happens, the price of gold and silver will be well on their way to the moon. $30,000 an ounce gold? Easy to imagine as it seems impossible for Washington to change its ways!
Today, the Dow Jones is only going up because the “policy makers” are using monetary inflation to maintain its valuation between 11,000 and 14,000. I say that because that’s what’s been happening since April 2010. Look at the Dow Jones’ BEV chart below. For almost three years it has frequently been within 5% to 10% of making a new all-time high. But the Dow Jones can’t get the job done.

Since 1885, the Dow Jones has functioned as a superb barometer of business activity. But sometime in the 1970s, financial journalism began downplaying business reporting, and began focusing on “economic news.” The shift was subtle, but significant. Financial news today contains theories of quack college “economic” professors”; you know, the guys in charge of the Federal Reserve’s “monetary policies.” Whether the Dow Jones goes up or down today has more to do with the Federal Reserve’s manipulation than an actual increase in production and profitability of American business.
Since October 2007, the Dow Jones has become a monetary zombie that responds only to daily “injections of liquidity” or lack of it. Should it see its first all-time high since October 2007 this year (and I doubt it will), it’s because Doctor Bernanke pulled out the really BIG needle from his little black bag. He has admitted as much on CNBC.
“Policies have contributed to a stronger stock market just as they did in March 2009, when we did the last iteration of this. The S&P 500 is up 20% plus and the Russell 2000, which is about small cap stocks, is up 30% plus.”
- Doctor Benjamin Bernanke, CNBC Interview with Steve Liesman 13 Jan 2011 (1:40 PM).
Whether the Dow Jones goes up or down is dependent on what Doctor Bernanke believes is best for “policy.” The stock market has been pathetic for years. Look at the Dow Jones’ BEV plot above; no new all-time highs since October 2007, yet it’s been within 10 BEV points of doing so for nearly two years. If the Dow Jones hasn’t made a new all-time high by now, I wouldn’t be surprised if we don’t see one for many years to come.
Why would that be? Because a real market driven bull market in stocks might very well complicate the management of the market rig devised by Washington and Wall Street’s “best and brightest.” Remember: the holy grail of modern finance is “STABILITY”, not profitability as it was decades ago. Here is the difference between reporting “on the economy” or on business. The difference is huge.
The “policy” dudes have a good feel for the public’s expectation of the stock market; the public wants a Dow Jones above 10,000 to preserve their sense of financial security. Sure, the public would like to see the Dow Jones performing as well as gold and silver have since 2000. But after the high-tech and housing bubbles, the public’s financial situation has been devastated. The investing public is no longer much of a factor in the stock market because they’re broke, but as “economic stability theory” has it, they won’t become unruly and vote the rascals out of office as long as the Dow Jones can be maintained above 10,000.
Well, it’s like my father told me: work hard, do what you’re told to do, and you’ll get screwed every time. So, the people you see on the street everywhere in America, and everywhere else too, are in no financial condition to push the stock market higher. Not when most of them (upon the advice of investment “professionals”) purchased a home at low mortgage rates during the housing bubble. They will be servicing a mortgage that’s twice the actual market value of their homes for decades to come.
We can see the absence of the public’s participation in the NYSE below. Note the plot is a 100 day moving average. Incredibly, in January 2013 the Dow Jones is only 5% from taking out its October 2007 all-time high, as daily trading volume has declined by 60% from its highs of 2006. We are seeing stock prices rise as market demand for stocks has plummeted. How can that possibly happen? It’s called “applied economics.”

To see the full significance of this, let’s look at a BEV plot of this same data. After the Dow Jones’ 1929 top, daily trading volume at the NYSE continued to decline until April 1942, falling 95% from its 1929 high. Not until 1961 did business on Wall Street (trading volume) return to its 1929 levels (32 years).
Currently, trading volume is down 60%, but it’s actually worse than that since 50% to 75% of daily volume is now High Frequency Trading (HFT). This recent phenomenon is where the big New York banks butt-in-line to buy shares ordered by their clients, which they then sell to their clients a few milliseconds later for a small profit to Wall Street but at a loss to their clients. Doing this millions of times a day amounts to billions of dollars in profit at the expense of investors. Federal Regulators are aware of this free money machine for Wall Street, but they do nothing as this abusive behavior is an essential component in the market fix.
When the stock market sees another 2008-09 event, the High Frequency Traders will exit the market, unless they are backstopped by the Fed and US Treasury, as was the case from 2007-09 when the Dow Jones fell 53% on rising trading volume. We don’t see this on these plots of the NYSE’s trading volume, as they are 100-day moving averages, but looking at the raw data it’s very clear that every down-day during the 2008-09 crash, when the public was running for their lives from Wall Street, someone with deep-pockets was buying in size to support market valuations. I expect on the next stock market plunge, we will once again see unnatural (rising) trading volume yet again when the Dow Jones declines deeply below 10,000.
I feel comfortable saying the Dow Jones is currently in a huge dead-cat bounce within a continuing bear market, because of the growing cluster of Days of Extreme Breadth (next chart). A day of extreme breadth is computed as follows;
NYSE Advancing issues – NYSE Declining issues = (+/-) 70% or More
Total Issues Traded that Day
Since November 1924, there have been only 356 days of extreme volatility at the NYSE, so they are rare market events. And as we see in the chart below, most of these extreme days occurred during the late 1920s to the start of World War 2 (a bad time to invest in the stock market), and from February 2007 to the present, another bad time to be in the stock market.
The current cluster of extreme days continues to grow, and historically, this is an indication of market instability – the very bane of current “policy.” We saw seven such days in 2012, and now 2013 has already seen a negative extreme day on January 02. A bad start for the new year.
Another marker of depression-scale bear markets is seeing excessive days of Extreme Volatility, or days where the Dow Jones moves up or down 2% or more from its previous day’s close. Since January 1900 (113 years ago), the Dow Jones has moved 2% or more from its previous day’s closing price only 1,791 times. That isn’t many extreme days of volatility when we realize that the NYSE has rung its closing bell 30,705 times since 02 January 1900.

Above we see a plot of how many 2% days the Dow Jones saw in a running 200 day sample. Every significant bear market (except for the #3 Bear bottom of April 1942) is seen above as a peak of extreme volatility. Why didn’t the -52% bear bottom of April 1942 produce a peak? Go back and look at my BEV chart for trading volume above. The bottom of that bear market coincided with the bottom of the trading volume decline that began 12.5 years earlier with the Great Crash of 1929. After enduring the 1930s, investors moved on to greener pastures and couldn’t have cared less if the Dow Jones was down by 52% or 100%. Besides, Pearl Harbor happened only four months before. People had other things on their mind than the “damned stock market.” I expect the Baby-Boomers too will know this feeling of stock-market repugnance in the years to come. But no doubt the smart money will be buying!
The things to note about this chart are the changes in peak patterns during the 20th century. From 1900-20, the stock market was a free market functioning under the gold standard, free from the “stabilizing operations” we have today. But after 1920, the Federal Reserve, with its “injections of liquidity” entered into market history. It was the Federal Reserve, not the boot-leggers that provided the “liquidity” that made the 1920s roar, and the 1930s a decade long hangover.
Dow Jones 2% days became very rare events from 1946 to 1971. It took that long for the Roaring 1920s’ generation to pass away, and their grandchildren, people with no personal memories of the 1930s, to seek the easy riches promised by Wall Street. Note what happened shortly after August 1971, after the US Treasury refused to redeem their paper dollars for gold, we begin seeing a pattern of increasing spikes in Dow Jones 2% days that culminated with the second largest spike since 1900 in March of 2009. This spike also occurred during the second deepest bear market bottom since 1885, and that is no coincidence.
Currently, the “policy makers’ stability operations” are keeping the Dow Jones volatility low, but the Dow Jones has not been free of extreme volatility for 200 days since 2006, and that is a concern. I have no advance knowledge of what is coming our way, and if the truth be told, Doctor Bernanke would admit this too. But I do know that currently politicians, lawyers, regulators, economists and predatory-bankers have more control over American business than do the businessmen who actually do something economically useful. When the house of cards now called “the economy” comes tumbling down, watch our financial media call it a failure of Capitalism. But it won’t be; it will be a failure of our left-leaning Big Government and Academia.
Mark J. Lundeen


