Gold Market Update
It was a big day for the Precious Metals sector on Friday, for the dollar broke down hard from its recent uptrend, and at the same time gold broke out upside from its Head-and-Shoulders base pattern. Silver anticipated this - it broke out from its base pattern back on Tuesday. These developments have grave implications for the dollar, but at the same time are believed to mark the start of major uptrends in gold and silver.
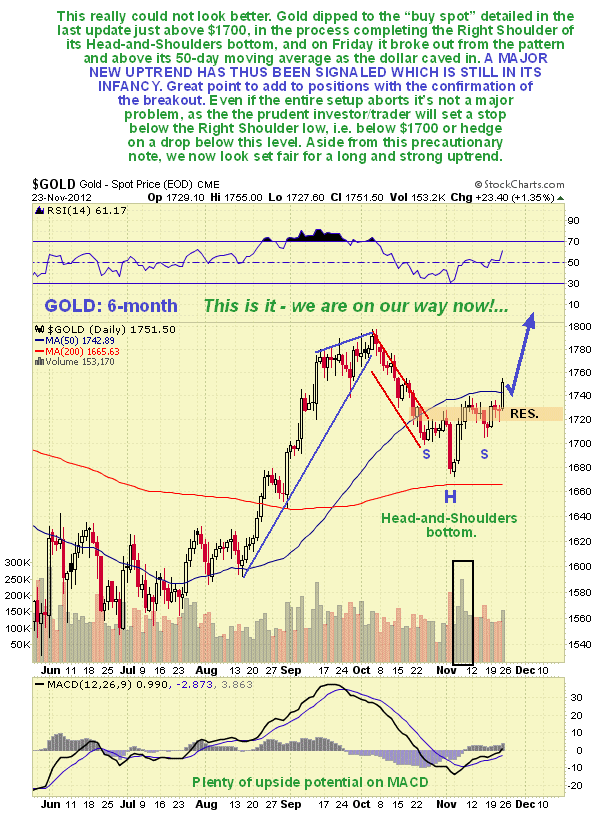
On its 6-month chart we can see how gold dipped to our "buy spot" just above $1700, detailed in the last update, in the process marking out the Right Shoulder of the small Head-and-Shoulders bottom that formed just above its 200-day moving average. Everything is now in place for a significant uptrend to get going, with the breakout on Friday from a fine completed base pattern, and the MACD indicator showing that there is still plenty of immediate upside potential from here.
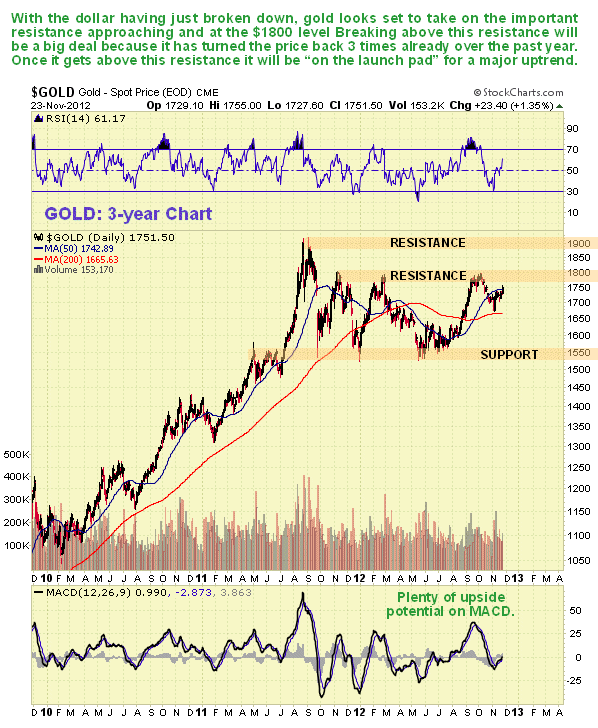
The 3-year chart is useful as it makes clear that there is an important resistance level overhead, approaching and at the $1800 level, which has turned the price back on 3 occasions over the past 13 months. It is thus clear that the surmounting of this resistance will be a strongly bullish development that should quickly lead to gold challenging its all-time highs, resistance at which should not prove to be much of an impediment, and it should then go on to break out to new highs and carry on up in a vigorous uptrend.
Gold looks just fine on its long-term chart going back to the inception of the bullmarket. It got over-extended by the latter part of 2011, which is why we have since had the lengthy period of consolidation. Now it is looking ready to break out to new highs and enter another major uptrend, and if it should make a run at the top return line of its long-term uptrend channel, as looks likely given the outlook for the dollar, then we are looking at a target for this uptrend in the $2700 - $3000 area - perfectly reasonable.
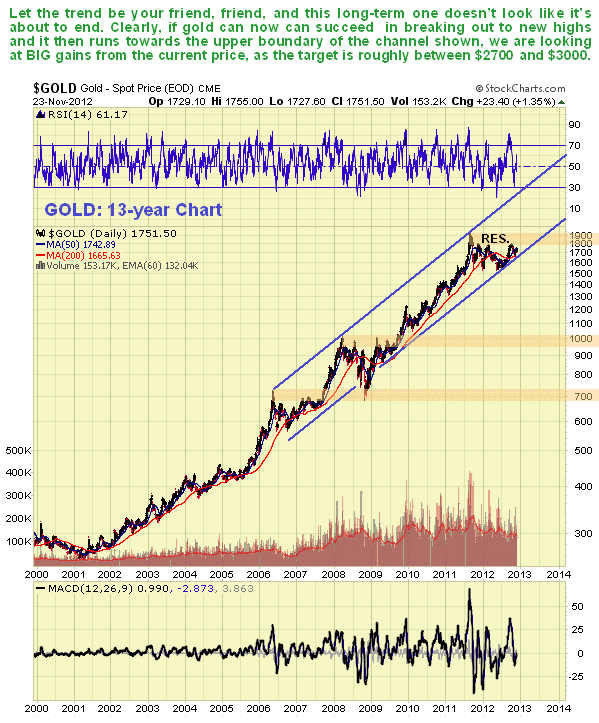
The long-term chart for gold also makes clear that all of the talk about it being manipulated and suppressed is arrant nonsense. With it having risen from about $250 at its low at the start of the bullmarket to its latest peak around $1900 last year, it doesn't look like the manipulators have had much success, does it? The fact of the matter is this - if currencies get debased, and they are being debased at an ever increasing rate, then gold, which is real money, is going to go up to compensate. That's all that there is to it, except for the fact that when hot money shows up on the scene in force, that is when these "bedrock" gains resulting directly from currency debasement are going to be compounded by a speculative mania and that hasn't even started yet.
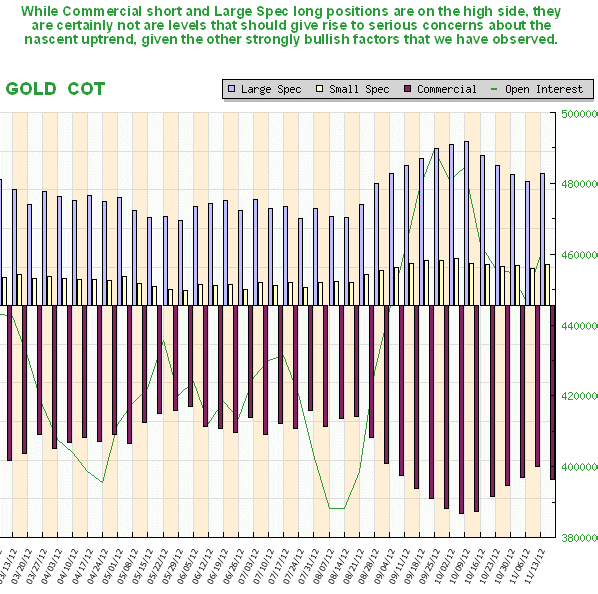
The latest COT chart for gold shows that while Commercial short and Large Spec long positions are on the high side, they are not at levels that should give rise to serious concerns regarding the potential of the nascent uptrend, given the other bullish factors that we have observed.
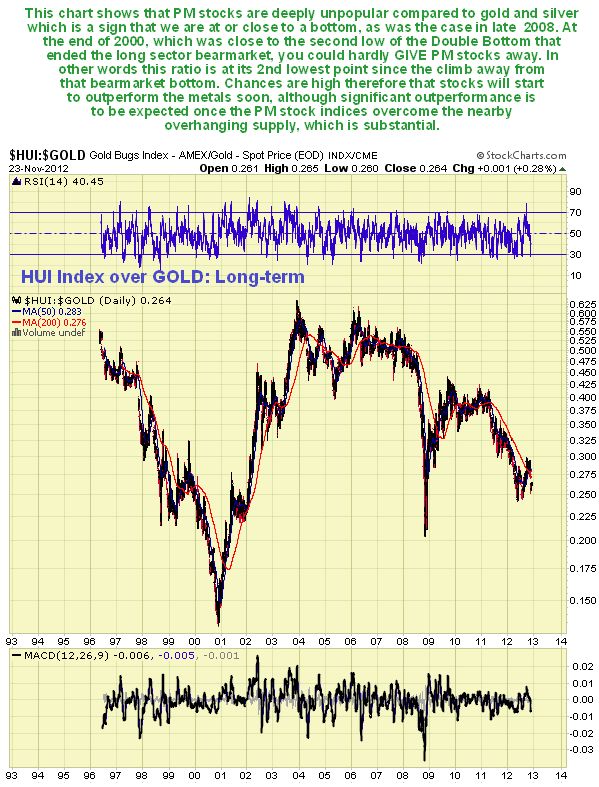
The recent deep unpopularity of PM sector stocks relative to gold is a sign that the sector has been out of favor, and is therefore an indication that we are, or close to a bottom. This ratio is showing its 2nd worst reading since the surge out of the bearmarket bottom late in 2000, the worst being that of the 2008 panic selloff.
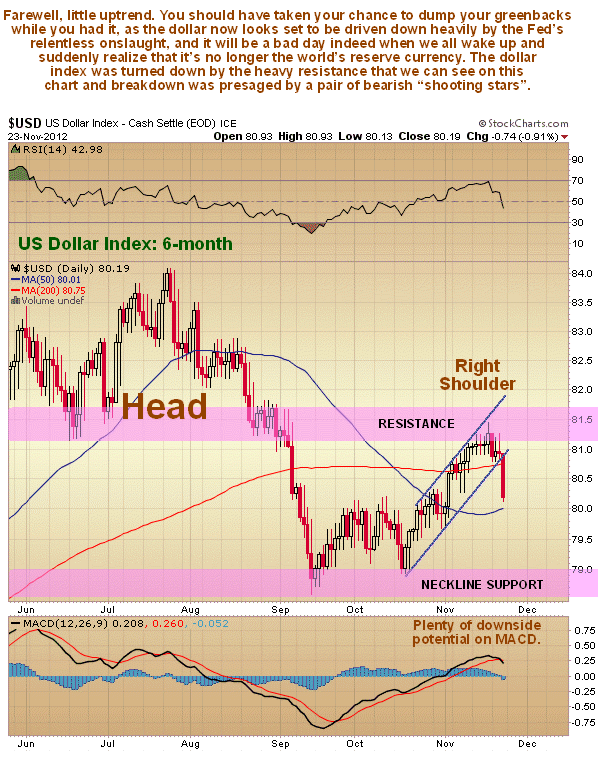
Beautiful technical action in the dollar. On Friday it broke down decisively from the modest little uptrend of recent weeks that took it up to mark out the Right Shoulder of a fine large Head-and-Shoulders top. On the 6-month chart we can see this recent action in detail, and how the advance failed beneath heavy overhead resistance, and was signaled in advance by 2 successive bearish "shooting star" candlesticks.
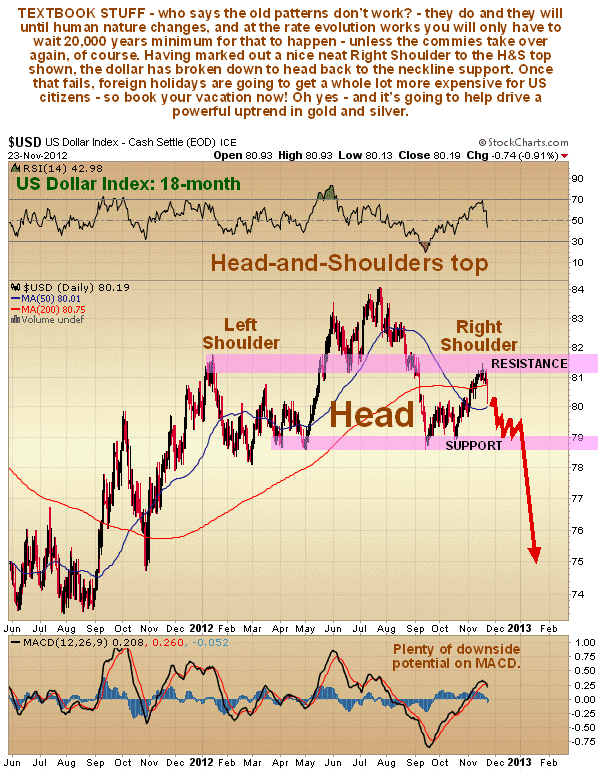
The 18-month chart for the dollar shows it is now dropping down to complete the Right Shoulder of the Head-and-Shoulders top. This may take a little while yet, but once the support at the bottom of this important pattern fails - and the Fed are doing everything in their power to make sure it does - then the dollar could plunge. So US readers should book and pay for their overseas vacations without delay and change over your holiday money too.
In conclusion, gold is viewed as having broken out on Friday to start a MAJOR uptrend, and thus it is certainly not too late to go long or add to existing positions, and one can guard against the (now considered remote) possibility of this rally being a B-wave trap by simply placing stops, either below the support at $1700, above which the Right Shoulder formed, or below the early November lows.
Silver Market Update
Clive Maund
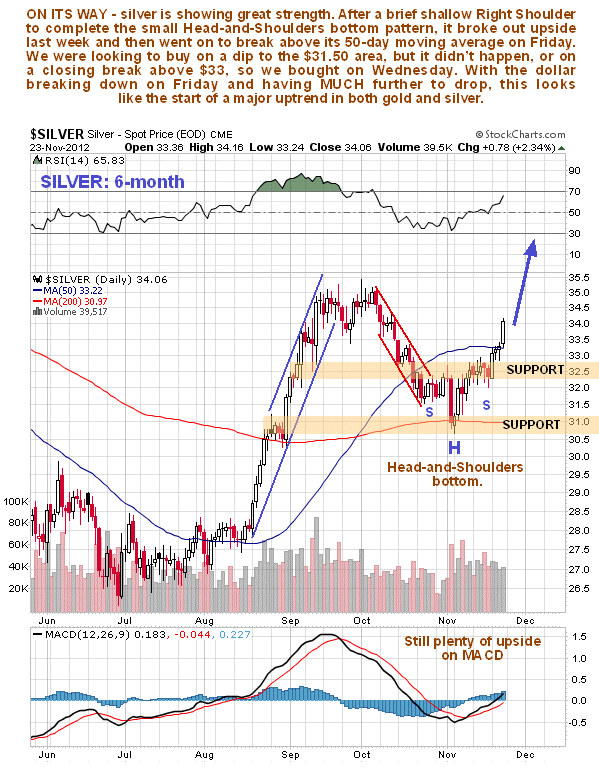
Recent action in silver has been very bullish. It barely paid lip service to the technical requirement to drop back and form a Right Shoulder to its Head-and-Shoulders bottom before breaking out of this base pattern back last Tuesday, without waiting for either gold to break out, or for the dollar to break down. When gold did actually break out on Friday, and the dollar broke down, it built on these achievements by breaking clear above the resistance near to its 50-day moving average.
On its 6-month chart we can see this strong action and how it is already on its way, launching into a new uptrend. In the last update we detailed 2 points to buy, 1 on a dip to about $31.50 to form the Right Shoulder. It did dip a little, but not so far, so we missed that chance to buy. The other point to buy was given as being on a closing break above $33 - that happened last Tuesday, so that's when we were in, theoretically at least, and thus we caught the surge on Friday. It should carry on up now, with occasional pauses to consolidate, and the MACD indicator, which is still close to neutrality, shows that there is plenty of upside potential from here before it becomes overstretched.
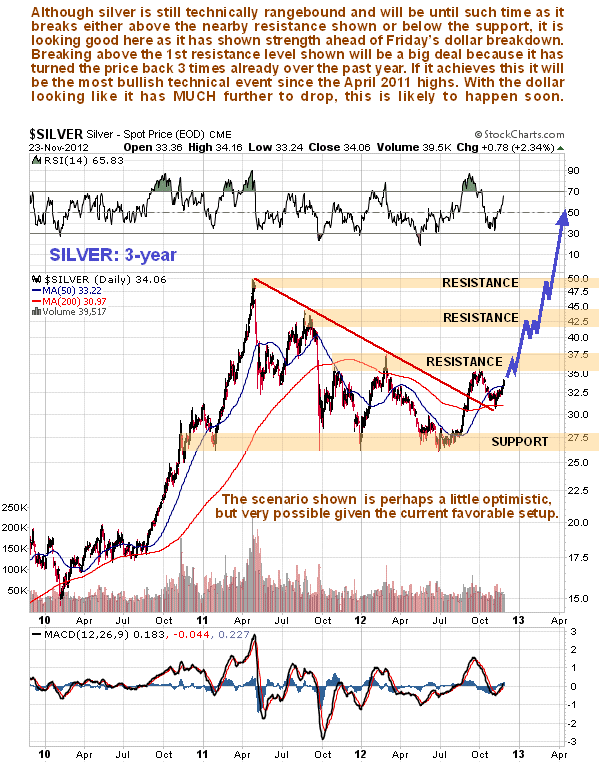
The 3-year chart is useful as it makes clear the importance of the nearby resistance level in the $35 - $37.50 area. This resistance level has turned the price back 3 times over the past 14 months, including the recent highs in September and early October, so it will be an important positive technical development when the price breaks above this resistance. Once it does it should run swiftly at the next resistance level, but this one, and the one approaching the highs, are not so strong and once the price succeeds in clearing all these resistance levels and breaking out to clear new highs, then upside momentum should build quickly.
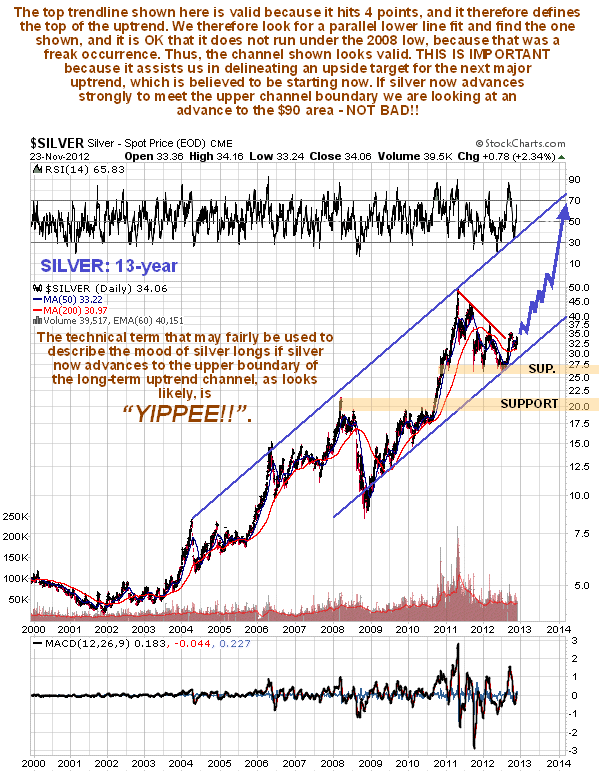
The long-term 13-year chart for silver, which shows the bullmarket in its entirety, is very interesting. Although it is obvious at first glance that silver is in a major uptrend, it is not that easy to immediately define the boundaries of this uptrend. Normally would draw a trendline under the lows, but on this occasion the uptrend is better defined by a trendline drawn across the highs. Searching then for a parallel lower trendline that fits, we find that if we ignore the freak 2008 lows, we get the fairly tidy parallel trendline fit shown. This is very important, as the correct definition of this uptrend enables us to define a probable target for the next major uptrend. As we can see, if silver now goes for a completed run at the upper boundary of this uptrend, and it looks likely given the terrible outlook for the dollar, then we could easily see it hit a target in the $90 area for the move starting now, which is not bad! With the price having just broken out of the corrective downtrend in force from the wild April - May 2011 highs, this major uptrend is believed to have just started.
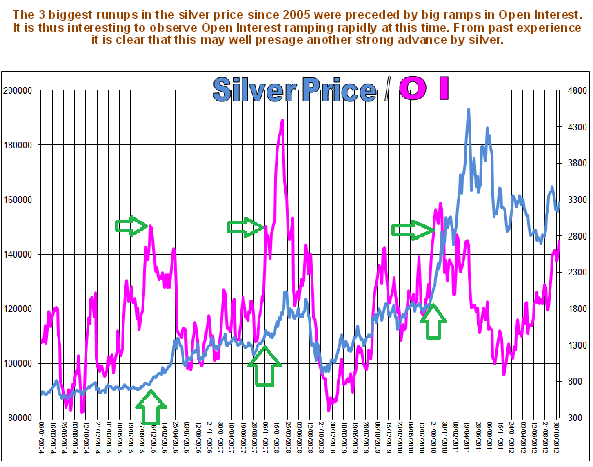
The recent silver COTs have led to us adopting an excessively cautious stance in the past few weeks, as it turned out. While the Commercial short and Large Spec long positions certainly remain at a high level, and should be noted, there is nothing to say that these cannot expand to much higher levels during a continued uptrend, so that they "fly off the scale". In addition, as we can also see on this chart, Open Interest is continuing to grow at a rapid rate. This is bullish and it is what preceded the 3 biggest ramps in the silver bullmarket to date.
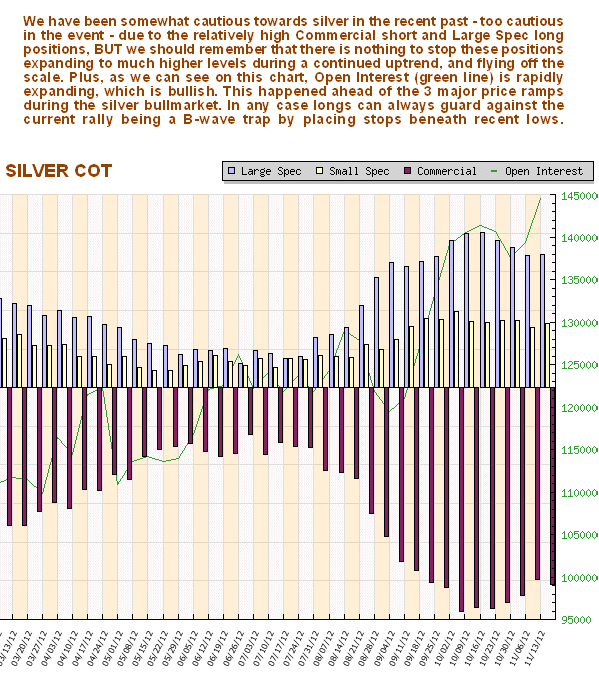
The following chart, courtesy of The Scarborough Bullion Desk in England - Scarborough is a seaside town on the east coast of England which is famous, not just for the Scarborough Bullion Desk, but also for beach holidays for those who are into hypothermia in a big way - is most interesting as it shows the ballooning of Open Interest on 3 occasions ahead of the 3 biggest price ramps of the silver bullmarket - now it's doing it again. Forget the scaling, which is awful, just compare the price with the Open Interest. Those of you who are familiar with silver price action in recent years will readily figure it out.
