Gold Correction


Gold and silver have been in corrections since they both had exceptional rally phases that topped out last year. Gold topped out with a double top, one high in August and the other high in September. Silver topped out much earlier as it's rally phase started earlier than gold's. Silver topped out in April of last year and the correction is now getting close to one year in the making. Both corrections are taking on the shape of a falling flag or downtrend channel with silver's further along in it's development. As you know I have turned cautious over the last several weeks as these consolidation patterns are still not suggesting that they are close to being completed. Just the opposites it true. Lets start with Gold as it has been forming a smaller consolidation pattern inside the bigger downtrend channel.
On the top left hand corner of the 8 month daily chart below you can see the double top that halted gold's rally off the 2008 crash low. Once the double top gave way it only took 3 days to find the first bottom at the 1530 area. That first low is the beginning of our most recent consolidation pattern that is shaping up as a rectangle. Over the next 6 weeks or so gold found it's first high at the 1800 area where it then went on to form a H&S top that signaled the next leg down would begin. That H&S top measured down to the 1526 area that was real close to the first leg down off the double top. That low at 1526 marked the 3rd reversal point in what now looks like a rectangle pattern. The next rally phase took prices up to the original high at 1800 where again gold ran out of steam as an unbalanced double top formed. Gold broke off that unbalanced double top with the flash crash signaling the top was in. As you can see we are presently trading below the double top hump making lower highs and lower lows.
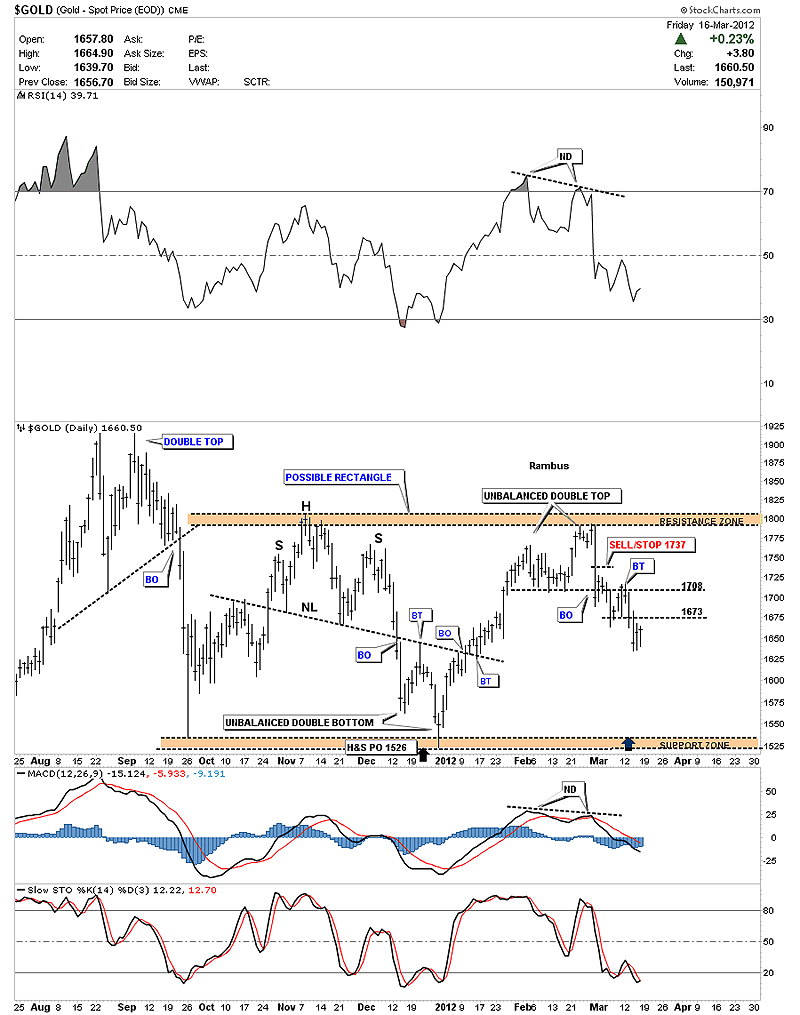
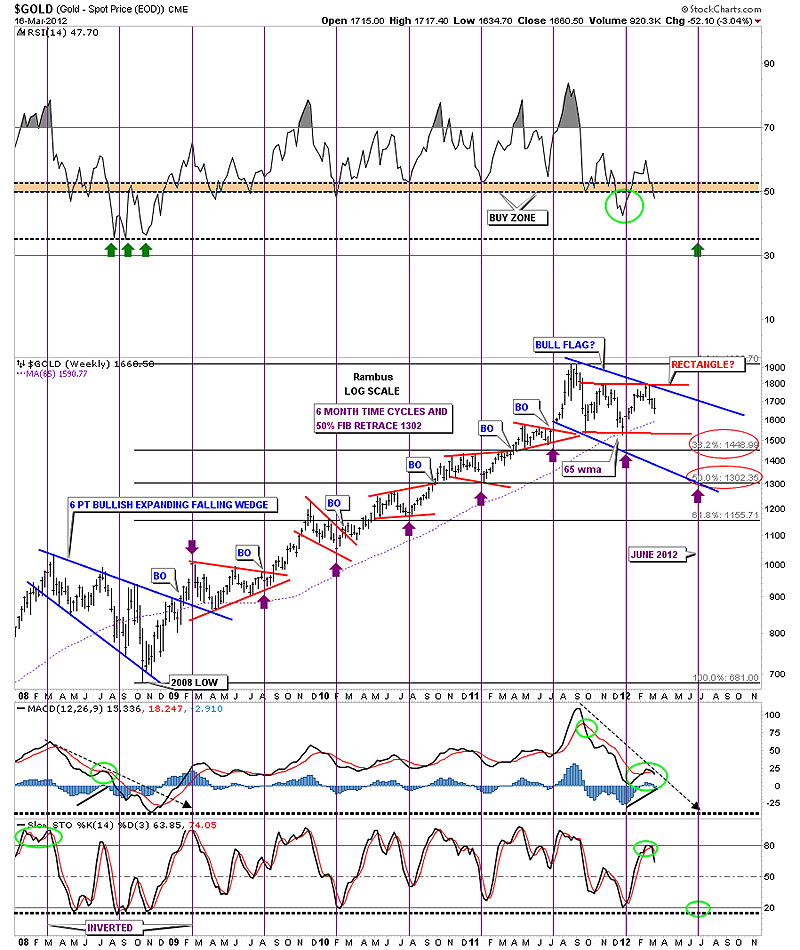
The next chart shows a year and a half of trading that will give you a longer perspective so you can see how the possible rectangle fits into the bigger picture. We closed Friday right on the thin dashed blue rail that is the halfway point in the rectangle at 1660. This center rail usually acts as support or resistance depending on which way the price is moving. The rectangle will not be completed until we reach the bottom blue rail at 1530 or so at which point one of two things will occur. The first scenario is that the rectangle will be a consolidation pattern and gold will decline further down to the 1400 area as measured by the blue arrows. This is the preferred scenario. The second thing that could happen is that gold bounces off the bottom rail of the rectangle around the 1530 area and rallies back up leaving a fifth reversal point signaling the rectangle could then be a reversal pattern to the upside. At this point it's still a little too early to say which scenario will play out but looking at the longer term chart and the 6 month time cycle chart may give us some clues as to which pattern will eventually prevail.

Next let's look at a weekly chart that shows the 6 month time cycle with Fibonacci retracements. Before we go to the 6 month time cycles we need to look at the 65 week moving average that has been one of the best moving averages for finding the bottoms in gold. After gold hit the 65 wma on the second leg off the double top, support was found which led to the rally back up to 1800 top blue rail of the rectangle. As you can see by looking back to just after the 2008 crash low the 65 week ma was never violated. That was also the case before the 2008 crash so this is a critically important moving average to keep a close eye. Now onto the 6 month time cycle that has been most accurate since the 2008 low calling every low except the very first one on the breakout of the 6 point expanding falling wedge which was inverted. As you can see the next cycle low is due in late June which is only 3 months away so there is still plenty of time for gold to chop around before putting in the next important bottom. I've added 2 Fibonacci retracements, one at 38% which comes in at 1449 and the 50% retrace that comes in at 1302 or so. When viewing this chart below notice the blue 6 point expanding falling wedge at the bottom left side of the chart that was the big correction of the first major advance of the bull market. Notice all the small red consolidation patterns that formed during the next major impulse leg up that ended with the top at 1920. Now to put our current blue consolidation pattern into perspective, think of all the action between the two big blue consolidation patterns as a major impulse leg, with the two bigger blue consolidation patterns as bookends. We are currently just correcting that big 3 year rally that came to an end at 1920 beginning of our current consolidation pattern.
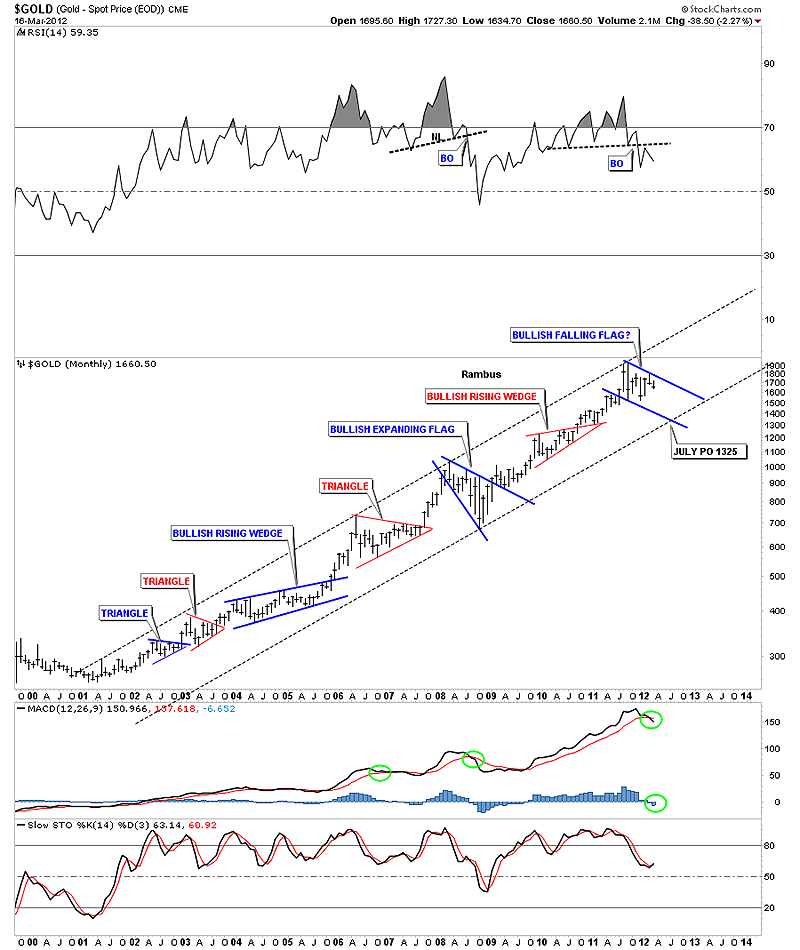
Just one more long term chart of the bull market for gold that goes all the way back to its beginning in 2001. The takeaway from this chart is the very nice clean uptrend channel and the bigger patterns that have formed at roughly the halfway point in each leg up. The top rail of the major uptrend channel has 3 major touches while the bottom rail only has one so far. Using the 6 month time cycle on the chart above I added a possible price objective for time and price that comes in around the 1325 area sometime in late June or July where the bottom rail of the major uptrend channel comes into play. Note the RSI at the top of the chart that has a topping pattern in place and also the MACD that has now crossed to the downside. The blue histogram is also below the zero line signaling weakness.
What these charts say to me is that gold is in a correction after rallying for almost 3 years off the 2008 crash low. This correction we currently find ourselves in is pretty normal when looking at the long term chart above. What is so painful is that the precious metals stocks have not participated in gold's rally which makes this otherwise normal correction seem very extreme in nature and skews our emotions. July has produced some very good bottoms for the precious metals stocks in the past. This year July may very well provide the precious metals complex with a most excellent bottom to pick up some bargains that will surely materialize if these charts play out close to expectation.
To Subscribe to Rambus Chartology and see Rambus' 10 Favorite PM Stocks and a World of Charts and Projections including the Chartology Forum where Rambus answers your Questions and even Charts your Favorite PM Stocks by Request, go to : www.rambus1.com
 Meet Rambus, a seasoned trader and technical analyst renowned for his unbiased and insightful chart work. Through his website, Rambus Chartology, and Substack newsletter, Rambus shares his expertise with a global community of subscribers, providing daily updates, commentaries, and hands-on training in the art and science of chartology. With his calm, humble, and down-to-earth approach, Rambus demystifies complex market trends, helping his followers navigate the challenges of today's volatile markets. Join the Rambus Chartology community today and discover a unique blend of technical analysis, trading expertise, and time-tested protocols. Subscribe now at www.rambus1.com or https://rambuschartology.substack.com/
More from Gold-Eagle


