Silver at a 600-Year Low; Breakout is Near
Let's talk silver, shall we? Over the past few weeks there has been increasing interest in the white metal sector after the vigorous rally in silver earlier this spring. One thing that has really blown me away is a super long-term silver chart that is being circulated among precious metals enthusiasts which shows silver's 600-year price history in 1998 dollars. Would you believe that silver hit a 600-year low back in 1992, and a secondary low in 1997? At that very time, value investor Warren Buffet began his much-publicized accumulation of silver while Bill Gates soon thereafter began buying shares of Pan American Silver. Do the insiders know something about silver's outlook that we don't?
Incidentally, I highly recommend viewing this long-term chart of silver for perspective on the major trends in silver. You can see it at the following url:
http://goldinfo.net/silver600.html
What really stands out about this chart is the fact that silver prices (as valued in 1998 dollars) have been mostly in decline ever since the all-time high of $806/ounce in the Year 1477. Looking at this chart there can be no doubt that silver has seen its low for many centuries and is poised to begin a new phase of rising prices.
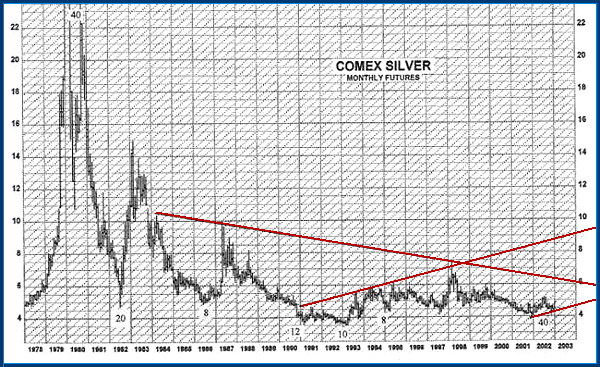
Now let's take a look at the 25-year monthly chart of COMEX silver futures. I've labeled the dominant long-term time cycles in this chart, and you can see how they have bottomed at major trading lows in silver since the early 1980s. The blow-off spike in silver prices back in 1979-1981 was a function of the peaking 40 year cycle, which is one of the most important time cycles of less than 100 years duration. Notice where its half-component, the 20-year cycle, bottomed in 1982, which left a massive V-shaped spike in the silver price line. Fast-forward 20 years later to 2002 and we have the next 20-year cycle bottom and, more importantly, the 40-year cycle bottom! A 40-year cycle bottom is where the 2-year, 4-year, 8-year, 10-year, and 20-year cycles all bottom in unison, producing a pivotal low from which a new phase of advancing prices can begin. Thus, Year 2002 was an important time low for silver.

Silver's *price* low occurred in 1992, when the 10-year cycle bottomed and the excess supply from the 1980s crash brought silver to its knees. After extraordinary upside runs followed by equally extraordinary declines, my observation is that markets tend to make lows in price ahead of time cycle lows due to the emotional extremes of the prevailing bear market. This has been true in the U.S. stock market in recent years and true as well in the gold and silver markets.
The peaks and troughs of the dominant time cycles is what causes trend lines and trading channels to form in the charts. For instance, in the above 25-year silver chart you will notice that a multi-year downtrend line was begun with the 1987 peak in silver prices and has been intact ever since. The 1987 price peak was formed by the peak in the 10-year cycle (which bottomed previously in 1982) and this led to the low of 1992 when the 10-year cycle bottomed next. Now that the 20-year cycle and 40-year cycles have bottomed, it is a fairly safe assumption to make that this more than 15-year downtrend line will be broken, probably sometime this year.
The next observation is made of the projected uptrend channel (see above chart) where the upper boundary is formed beginning around 1991 (just after the 12-year cycle bottomed) followed by peaks in silver's price in 1993, 1994, and 1995. This latter price peak was mostly a function of the peaking 12-year cycle. The next significant peak in silver's price came in 1998, which met resistance at the declining downtrend line which began in 1987 (see chart) as well as the upper boundary of the projected uptrend channel. From the 1998 high, silver declined all the to the 40-year cycle low of 2002 (actually making its price low in late 2001).
After the silver market action of the past few months, we can now see an established uptrend line which is exactly parallel with the upper boundary of the projected uptrend channel. Thus, the projected uptrend channel is no longer merely a projection but a reality. Now all that remains for the silver market to start charging ahead is to break above the 15-year downtrend line, an event that could easily happen in the politically charged and highly eventful year of 2003.
June 6, 2003
Clif Droke is the editor of the Gold Strategies Review newsletter, a monthly forecast and analysis of gold and silver futures and precious metals stocks. He is also the author of numerous books on finance and investing, including most recently "Junior Mining Stock Yearbook 2003-2004." Visit his web site for free samples of his analysis at www.clifdroke.com


