Gold Forecast: Gold's Current Rally Heads into Mid-Term Peak


 From the comments made in my last article (i.e., 'Gold's Potential Bottom'; from 3/5/23), Gold was at or into bottoming territory, with that low expected to come from our 72-day time cycle, which is shown again on the chart below:
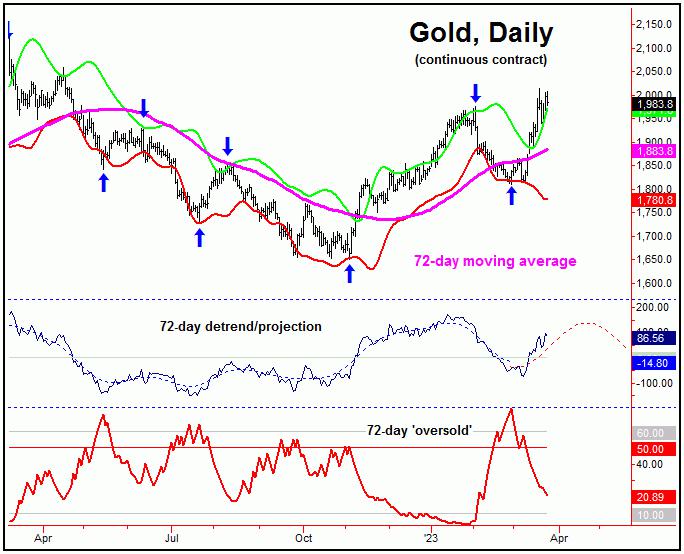
In terms of time, this 72-day cycle component had projected its last low to form around the late-February to early-March timeframe, though with a normal plus or minus variance in either direction. The actual low came in on February 28th, with the tag of the 1810.80 figure.
As mentioned in my prior article, the ideal path was looking for a spike above the upper reference line with our 72-day cycle's 'oversold' indicator, which is something we would expect to see at or near bottoms with this particular cycle. This action occurred within 4 trading days of the actual bottom for the move.
In terms of price, it was the 3/10/23 reversal back above the 1866.00 figure (April, 2023 contract) which confirmed our 72-day trough to be set in place - thus triggering in the most recent upward phase of this wave.
In terms of patterns, the decline into the 72-day cycle low was expected to end up as a countertrend affair, thus forming a 'higher-low' - holding above the November, 2022 trough. Going further, the average rally phases with our 72-day cycle - when coming off this pattern - have been around 14% off the bottom, thus suggesting the potential for an eventual push up to the 2060's or better (plus or minus) before this wave tops.
Mid-Term Picture
In terms of patterns, as mentioned above the last decline phase with the 72-day cycle was favored to end up as a countertrend affair, inside the larger upward phase of our bigger 310-day component, which is shown again on the next chart:
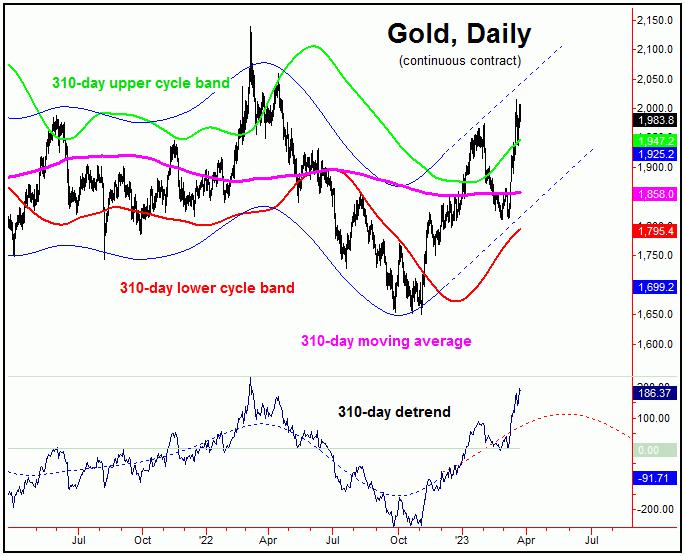
In terms of time, this 310-day cycle has been viewed as pushing higher into mid-to-late Spring of this year, then to be on the lookout for the next mid-term peak to form. That peak should come from the combination of 72 and 310-day cycles, and is something we are now on the technical watch for in the coming weeks.
In referencing that technical picture, there are some noteworthy observations. The first goes back to our 72-day chart. That is, our 72-day 'oversold' indicator (which moves inverse to price action) still has room to move to the downside, thus making the inference for additional price strength - before this wave attempts to peak.
As mentioned earlier, if we take the average rally phase percentage of 14%, we know there is the potential - but never the guarantee - for a push up to the 2060's or better before the next 72 and 310-day top attempts to form. A move into this price zone - if seen in the coming weeks - would be the ideal spot to be on the lookout for the next mid-term peak to form with the metal.
Having said the above, there is one brewing technical negative, which comes from our Gold Timing Index, which is shown again on the chart below:
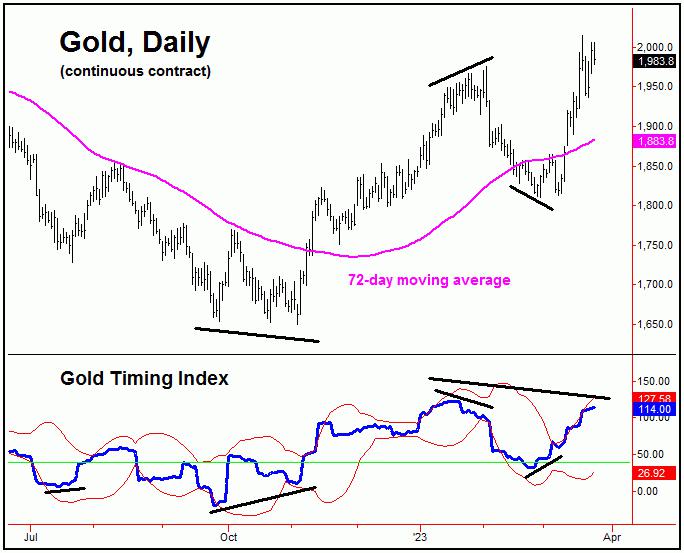
Our Gold Timing Index is a key timing indicator for our work; most especially, when it registers a divergence against a lower low (or a higher high) for the swing.
Back in late-January, this indicator alerted us to a potential peak forming with the Gold market, which we knew would come from our 72-day time cycle.
Going further, the indicator also registered another divergence at the 1810.80 swing low, made in late-February. This action also gave us an early 'heads-up' on a potential bottom forming from this same 72-day cycle. As mentioned earlier, our confirmation of the same came with the price reversal back above the 1866.00 figure, which has seen some additional 148 points of upside follow-through.
As for the current market action, our Gold Timing Index is now showing yet another divergence from price - though this is not major at present time, and could easily be reversed in the coming days/weeks; we have to see how the action unfolds as we move along.
Regardless of any of the above, the next mid-term peak should come from our 72 and 310-day time cycles. From whatever high that is seen with these waves, the odds will favor the largest percentage decline of this year to play out in the months to follow - a decline which could be something in the range of 20% or more - before bottoming our 310-day wave again, for another sharp rally into next year.
With the above said and noted, we are getting very close to confirming our next downside price 'reversal point' for our 310-day cycle, with these numbers always posted in our Gold Wave Trader market report. Stay tuned.
Jim Curry
The Gold Wave Trader
http://goldwavetrader.com/
http://cyclewave.homestead.com/
********


