Gold Forecast: Gold's Potential Bottom


 From the comments made in past articles, the Gold market was set for a sharp correction phase into early-2023, based upon the configuration of one of our most dominant cycles, the 72-day wave - shown again on the chart below:
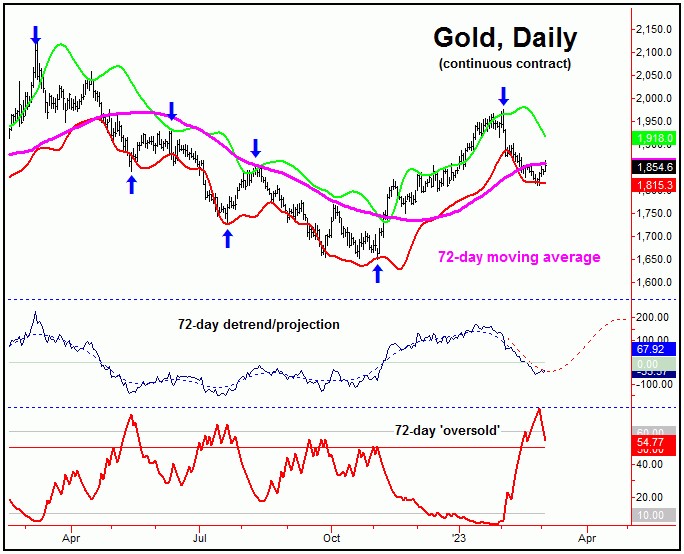
In terms of price, it was the February 3rd reversal below the 1912.60 figure (April, 2023 contract) which confirmed the downward phase of our 72-day wave to be back in force, an action which targeted a drop back to the 72-day moving average or lower. This magnet/target was easily met with the decline that followed.
In terms of time, our detrend that tracks this 72-day wave had projected its low to form around the late-February to early-March timeframe, with a normal plus or minus variance in either direction. So far, the lowest low was made with the February 28th tag of the 1810.80 figure, which is within this plus or minus variance for a bottom with this 72-day wave.
In terms of technical action, our ideal path was looking for a spike above the upper reference line with our 72-day cycle's 'oversold' indicator, which is something we would expect to see at or near bottoms with this cycle.
Going further, in our Gold Wave Trader market report, we noted a developing divergence in our Gold Timing Index, which is shown on the chart below:
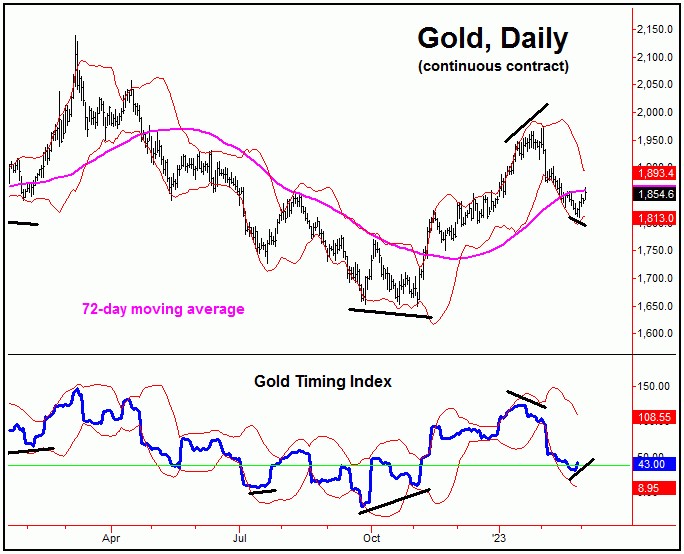
Of note is that our Gold Timing Index recently registered a slight divergence against the 1810.80 price low - which was seen as at least a mild technical positive. Whether it will signal our 72-day trough remains to be seen, though it did support the idea of a short-term rally phase to follow, which our work suggested would take gold prices back to the 20-day moving average or better.
Mid-Term View
In terms of patterns, the decline with the 72-day cycle was favored to end up as a countertrend affair, inside the larger upward phase of our bigger 310-day cycle, which is shown again below:
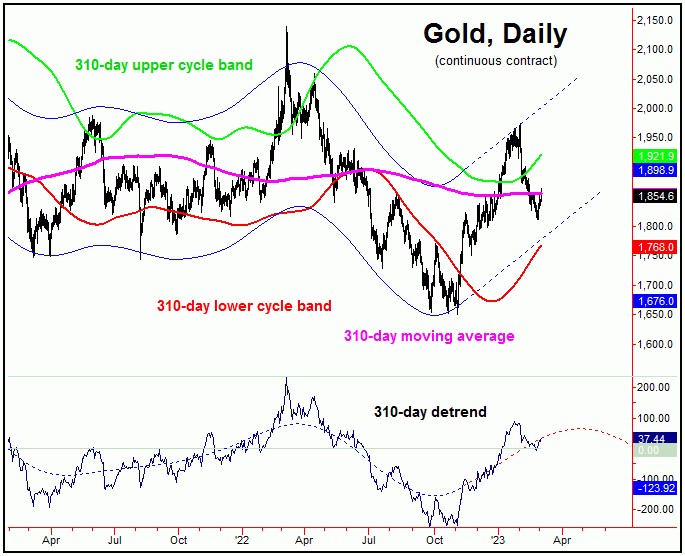
In terms of time, this 310-day cycle is seen as pushing higher into mid-to-late Spring, before the next mid-term peak attempts to form for Gold. From there, the odds will move in favor of the largest percentage decline of the year to play out in the months to follow, before bottoming our 310-day wave for another sharp rally into next year.
As mentioned, the recent correction phase with our 72-day wave was favored to end up as countertrend. If this path ends up as correct, the next upward phase of this cycle could see a rally of some 14% or more off the bottom, taking Gold back above the 1975.20 swing top in the process - before topping our larger 310-day component.
With the rally seen in recent days, there is now the potential that our 72-day trough is set in place, though this is still speculation - as the move up could also end up as a countertrend affair, before giving way to a lower low, only then to bottom this cycle. Should the latter occur, then there would be strong support near the lower/rising 310-day cycle channel, currently around the 1790-1800 region for Gold.
Otherwise, we will be watching our upside price 'reversal points' for Gold, which - when taken out higher - would be the strongest signal of a turn higher with our 72-day cycle component, with the latest numbers always posted in our Gold Wave Trader report. Stay tuned.
Jim Curry
The Gold Wave Trader
********


