Gold Market Update


Most would be investors and speculators in the Precious Metals sector at this time look and behave like the raw recruits at the start of the film An Officer and a Gentlemen - listless and muttering pathetically "This might not be the bottom - it could go down again" - so listen up you 'orrible lot and pull yourselves together - by the time you are done reading this you are expected to have cleaned yourselves up, straightened yourselves out and be ready for action - and insubordination will not be tolerated.
Now that I've got your attention we will start by looking at the 3-year chart for gold. On this chart we can see that following the peak attained last August, gold has been consolidating/reacting in some sort of triangular pattern. Some see this pattern as a bearish Descending Triangle and a top area. There are various reasons why this is not thought to be so. One is that there has been no speculative mania phase involving high public participation in this gold bull market so far, and as pointed out by Richard Russell, major bull markets of the type we have seen in gold typically end with such a phase. Secondly, the pattern has the attibutes of a 3-arc Fan Correction, breakout from which will be signaled by gold breaking above the 3rd fanline shown on the chart, which should trigger a powerful uptrend. The support at the bottom of the pattern is clear, important and obvious - so obvious in fact that we should not be surprised to see Big Money force a false break below it in order to trigger stops to run the little guy out of his remaining positions ahead of a surprise reversal to the upside. Nevertheless, buying here has an extraordinarily favorable risk/reward setup, as risk can be strictly limited by placing stops below the support, and upside potential from here is very substantial. What if Big Money does stage the stunt of crashing the support and your stops ARE triggered. We've got an answer to that too - buy back if the price subsequently rises back above the breakdown point, which will be evidence that the move was phoney, and accept the whipsaw loss as the price of the game.
The 6-month chart is useful as it reveals that gold has been trending slowly lower since March beneath a very important downtrend line that is embedded within the Fan Pattern. The importance of this downtrend should be clear from the fact that the price has been repelled from it no less than 8 times already either on contact with it or on close approaches. What this means is that clear move above this trendline will constitute an important breakout that should lead to the price going on to surmount the resistance at the 3rd fanline not far above soon after, and thus a breakout above this trendline will be a major buy signal, although from the evidence we are reviewing today, we don't need to wait for that to happen before establishing positions.
Alright, so why would we remain bullish even if gold crashed the key support at its September and December lows? - wouldn't the failure of such obviously important support lead to a plunge? - well, it probably would but it would also be expected to be followed by a rapid reversal to the upside - here's why..
As the Hulbert Gold Sentiment chart shown below makes plain, the masses are extremely bearish on gold, and when they are it is almost always at, or close to, a significant bottom.
Chart courtesy of www.sentimentrader.com
Next we look at the chart showing the Rydex Traders Precious Metals assets. The Rydex Traders specialize in holding low quantities of Precious Metals at price bottoms for the sector, as this chart makes plain. What we are seeing here is thus a good omen for gold and silver prices.
Chart courtesy of www.sentimentrader.com
Now we turn our attention to the dollar, for if gold and silver are poised to rally we would expect to see signs of impending weakness in the dollar - and we do, not so much on the price chart, but on indicator charts.
The 6-month chart for the dollar index shows that a second wave up is underway, following the reaction after the big 1st wave up in May, but it also shows that the dollar is having trouble following through and making significant further progress, so far at least. The MACD indicator at the bottom of the chart additionally shows momentum failure on the new high for this move about a week ago, that could be the precursor to a breakdown from the potential bearish Rising Wedge shown, although going on this chart alone it is still too early to say, as what could happen is that momentum improves significantly soon on further strong gains that take the index up out of the potential wedge pattern. However, there is strong evidence on dollar sentiment charts suggesting that such strength will not manifest and that instead the dollar will turn lower and break down soon. We will now look at this evidence.
The following chart shows that the public are now very bullish on the US dollar, with public optimism being very close to its most extreme readings, it also shows that when the public gets like this it is a sign of a top and an imminent reversal. The vertical bars drawn on the chart show the times when the public got it wrong in a big way both on the long and short side, just in past several years. Quite obviously, if the dollar soon turns tail and heads south, it will likely drive a strong rally in gold and silver.
Chart courtesy of www.sentimentrader.com
Finally, we are now approaching a seasonally bullish time of year for the Precious Metals that will a exert a positive background influence and provide a tailwind for any advance, as the following chart shows...
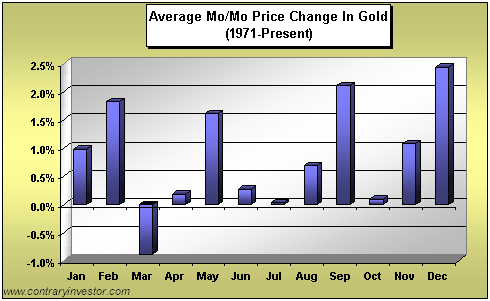
So there you have it - everything appears to be shaping up for a major uptrend to begin in gold soon. The 2 most effective strategies at this point are as follows; you have the choice of buying now (adding) to take advantage of the current highly favorable price/time setup, placing protective stops beneath the strong support at the September and December lows - if these stocks are triggered, possibly due to an orchestrated campaign to run people out of positions, then you stand ready to jump back in if the price breaks back above the support, accepting the minor whipsaw loss. The other approach is to wait until the price makes a clear breakout above the important trendline within the Fan pattern shown on our 6-month chart - this approach is safer but would involve sacrificing some gains.
So now that you are looking shipshape and Bristol fashion you know what to do - don't just stand there - get on with it!!
Silver Market Update
Clive Maund
Silver investors and speculators are amongst the manic-depressive you can possibly find in the investment world. When they are playing maximum credits on the slots and passing round boxes of cuban cigars and taking out massive loans to buy Ferraris and Lambos you know it's time to watch out. When they retreat into the shadows, only coming out to hurl themselves off bridges and other tall structures, mumbling about the "cartel" as they plummet earthwards, you know it's getting time to buy - and that is the situation we now find ourselves in. In this update we are going to examine evidence which suggests that, despite the fragile looking price pattern, silver is going to turn surprisingly strong in short order, or alternatively, if it does break down, it turns out to be a false move that is swiftly followed by a dramatic recovery.
On its 3-year chart we can see that silver has been severely testing its key support at and above its September and December lows in recent weeks, and with its falling moving averages bearing down on the price overhead, and this being the 3rd major test of this key support, clearly there is some risk that it could crash it and plunge, yet while this is certainly true, various indicators are telling a story of gathering internal strength, and we will examine these a little later.
Staying with the 3-year chart a very important point to note is the current unbeatable risk/reward ratio. With the price hard down on support after a long period of retreat, those buying here have the opportunity to get in right at the start of a major uptrend if it does start higher from here, and can guard against serious loss by the simple expedient of placing close stops beneath the support. If this is obvious to us, then you can bet that Big Money is aware of it, and by Big Money we mean those with sufficient clout to muscle the market around to their own advantage. So what might they do here to make even more money? - crash the support, and run the little guy out of his remaining positions before a dramatic reversal back above the support leading to the major uptrend starting that we are anticipating. This is why it is so important to be ready to jump back in if, after failure of the support, the price then reverses back above it again, accepting the modest whipsaw loss as the possible cost of this strategy. Given the unusually bullish COTs and sentiment indicators for silver, it does not look likely that failure of the support would lead to more than a brief plunge that is quickly reversed, the only exception to this being if we see a 2008 style market wide total meltdown, and while this of course possible it does not look likely over the short to medium-term. The Accum-Distrib line shown at the top of the chart looks remarkably positive and is in itself a good omen, although we know from past experience that this indicator cannot always be relied upon. The current very low volume, about the lowest since the 2010 and 2011 Christmas holidays, is another positive sign. A new uptrend in silver will really gain traction and accelerate once the price succeeds in breaking above the red downtrend line shown on the chart.
The 6-month chart for silver shows a downtrend in force from March that parallels the one in gold. With the price approaching and then backing off from the upper boundary of this downtrend about 8 times now, it is clearly valid and very important, and while for various reasons we are thought to be at an optimum entry point here, the safer approach for would be buyers is to wait for the price to break out upside from this downtrend boundary, which as it is now close by above, would not involve missing much in the way of gains - unless that is the price takes off like a rocket upon breaking out - which is quite likely given how obviously important this downtrend is. There are several other lesser but still important points to note on this chart, which are the run of "doji" candlesticks that appeared last week that are indicative of a situation of extreme indecision - total standoff, but coming as they have after a drop they indicate a higher chance of a resolution to the upside, especially given that upside volume last week was predominant, which we can see reflected in the rising Accum-Distrib line shown at the top of the chart (On-balance Volume, not shown, also rose). Lastly the Bollinger Bands also pulled in tightly, signifying that pressure is building for a big move.
From what is set out above it will be clear to more sophisticated traders that we now have a near perfect setup for playing it both ways - a raft of straddles (Calls and Puts with the same strike price) or "strangles" (Calls and Puts whose strikes are both out of the money, and which are thus cheap) - and the current low volatility, if it persists into tomorrow, will mean you can get these on board cheaply. If the support fails and the price plunges you quickly ditch the Puts for a whacking great profit and hang on to the Calls. If, as we suspect, the breakdown is the result of Big Money running the little guy out of his positions by triggering his stops, then we can look forward to a rapid reversal back above the support enabling the trader to at least recoup the cost of the Calls and very possibly make a profit on them too. If the new uptrend develops from here, then you simply hang on to the Calls and write off the Puts, and you should end up with big gains.
A big reason that we are believed to be at or very close to a bottom here is the latest silver COT, which looks exceptionally bullish, with the Commercial short positions being close to record lows for this bullmarket, and the Large and Small Spec long positions being close to record lows. Unless we are just entering an era when things are suddenly very different, this is a classic indication of a major low in silver. The rationale behind the bullish implication of this is that the Large and Small specs' interest in silver is at a very low ebb, so their long contracts, which the Commercials counterparty, are a very low level reflecting this lack of interest.
Chart courtesy of www.sentimentrader.com
The silver public opinion chart shown below is such a reliable barometer of the foolishness of most silver speculators and traders that it is almost comical. Why don't they refer to it? - just too stupid, I guess. It's a good thing they don't because it means that people like us can use it to our advantage. As we can see the "great unwashed" have a low opinion of silver at this time, and that has to be bullish.
Chart courtesy of www.sentimentrader.com
Finally, the long-term 15-year chart of silver relative to gold is interesting as it shows several interesting things. The first is that during the early days of the Precious Metals bullmarket silver underperformed gold, and it got treated as almost worthless trash during the 2008 market crash. Then, after a period of recovery, it really went nuts in a big way for the first time ever in late 2010 and early 2011, with silver speculators becoming totally manic before being overcome by blind panic and exiting their positions just as fast or even faster. Now silver bugs are licking their wounds and feeling decidedly timid after the severe kicking they have received since May of last year - it's kind of sad really considering how attractive silver is now compared to those earlier heady days - but we can surely count on them getting interested again - once the new uptrend has become well established.
Clive Maund, Diploma Technical Analysis
Copiapo, Chile, 22 July 2012

Clive P. Maund’s interest in markets started when, as an aimless youth searching for direction in his mid-20’s, he inherited some money. Unfortunately it was not enough to live a utopian lifestyle as a playboy or retire very young. Therefore on the advice of his brother, he bought a load of British Petroleum stock, which promptly went up 20% in the space of a few weeks. Clive sold them at the top…which really fired his imagination. The prospect of being able to buy securities and sell them later at a higher price, and make money for doing little or no work was most attractive – and so the quest began, especially as he had been further stoked up by watching from the sidelines with a mixture of fascination and envy as fortunes were made in the roaring gold and silver bull market of the late 70’s.
Clive furthered his education in Technical Analysis or charting by ordering various good books from the US and by applying what he learned at work on an everyday basis. He also obtained the UK Society of Technical Analysts’ Diploma.
The years following 2005 saw the boom phase of the Gold and Silver bull market, until they peaked in late 2011. While there is ongoing debate about whether that was the final high, it is not believed to be because of the continuing global debasement of fiat currency. The bear market since 2011 is viewed as being very similar to the 2-year reaction in the mid-70’s, which was preceded by a powerful advance and was followed by a gigantic parabolic price ramp. Moreover, Precious Metals should come back into their own when the various asset bubbles elsewhere burst, which looks set to happen anytime soon.
Visit Clive at his website: CliveMaund.com
More from Gold-Eagle


