A High Price Earnings Ratio Is A Danger Laden Perilous Cross Stockholders Must Bear


The PRICE EARNINGS RATIO is sometimes referred to as the "multiple", because it shows how much investors are willing to pay per dollar of earnings. If a company were currently trading at a multiple (P.E.R.) of 20, the interpretation is that an investor is willing to pay $20 for $1 of current earnings.
Generally a high P.E.R. ratio means that investors are anticipating higher growth in the future.
The Perilous History of Exorbitantly High P.E.R. Ratios
Wall Street history is fraught with sad experiences of hapless investors caught bearing the crushing burden of stocks with outrageously high P.E.R. Ratios. This study will only address the most notorious cases that caused incalculable financial damage to the markets. The two most infamous are RCA (1929) and Microsoft (2000) . Those two will be used in this analysis as benchmarks to critically analyze what may turn out to be potentially the most devastating of them all: Facebook (2014).
RCA (1925-1929) and Microsoft (1993-1999)
In the Roaring 20s (1920-1929) the darling of Wall street was RCA. No other stock came close to the glamour and market performance of RCA. The company was the state-of-art in radio technology. RCA was the great glamour stock of the Roaring 1920s. It was like what the computer stocks were in a later age (ie 1990s). It was very exciting, it was very open-ended. Enormous amounts of money were made in RCA’s high-flying stock.
Consequently, RCA’s stock soared 500% from 1924 to its peak in late 1929. Greed intoxicated investors threw caution to the wind by wildly bidding its price to the point where RCA boasted an astronomical price/earnings ratio of 72:1 ---- with the price peaking at nearly $59/share.
Then the October 1929 Crash began:
On October 27, 1929 RCA traded at its all-time record high of $58.50 per share. Then a wave of selling hit the market on October 28, 1929 (today known as “Black Tuesday“). On that one day RCA closed at $40.25 per share (down -31% on that day), which was only the beginning of a long grinding Bear Market. By August 11, 1930, RCA was trading at $8.88 (down a cardiac-arrest -85% during the first 9 months of that Bear Market). And RCA finally bottomed in 1932 at a mere $2.50 per share (down -96% from its 1929 peak when it boasted a 72:1 Price Earnings Ratio).
Enter MICROSOFT With A P.E.R. Of 56:1
In the 1990s MICROSOFT was the quintessential pool stock…(and not unlike RCA in the 1920s ). Consequently, the allure of Microsoft captivated and galvanized the attention of innocent investors in the 1990s. With considerable hoopla and Wall Street media hype, MICROSOFT went ballistic, soaring 1,620% ($2.50-$43.00) from 1994 to 2000, when it boosted an astronomical P.E.R. of 56:1 in late 1990s…indeed colossal by historical standards.
Aghast that MICROSOFT’s P.E.R. was not only discounting the near future…but also the HEREAFTER, I penned the following analysis in October 1998:
“ RCA (1925-1929) and MICROSOFT (1994-1998)” – Please see: https://www.gold-eagle.com/article/rca-1925-1929-and-microsoft-1994-1998-0
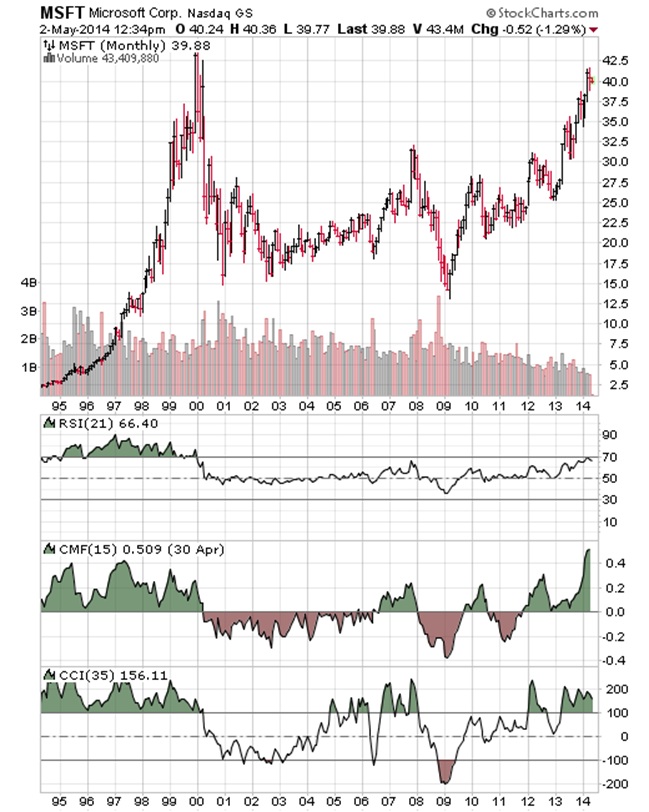
Subsequent to my October 1998 analysis, Microsoft (MSFT) stock plummeted -65% during first 9-months of the Bear Market of 2000-2001. Below is Microsoft’s chart showing the horrific plunge in its stock price during the 2000-2001 bear market. HOWEVER, today MICROSOFT sports a modest 15:1 P.E.R. But alas, MSFT price trend is close to forming a bearish Double Top pattern…in addition to its Technical Indicators, which have all topped out (RSI, MACD & CMF).
FAST-FORWARD TO 2014….ENTER THE EUPHORIC CYBER-SPACE FACEBOOK…with a P.E.R. of 80:1
FACEBOOK…a speculative orgy par excellence…is a purveyor of new technology like RCA was in the 1920s and MICROSOFT in the 1990s.
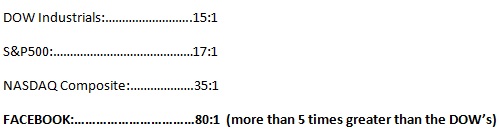
As present day benchmarks for this study (as of May 9, 2014), here are the current P.E.R. of the principal US stock indices vs FACEBOOK:
History is testament that an outrageously high P.E.R. can be the Achilles Heel of any high-flying stock in an over-valued market environment (like today). BUT WAIT, FACEBOOK has two Achilles Heels: P.E.R and Price/Book.
A Price/Book (P/B) ratio is used to compare a stock's market value to its book value. It is calculated by dividing the current closing price of the stock by the latest quarter's book value per share. It is also known as the "price-equity ratio". A lower P/B ratio could mean that the stock is undervalued – and a higher P/B ratio could mean that the stock is over-valued. It varies from industry to industry. Therefore, one must make comparisons to determine relative value.
Here are some Interesting Current Price/Book Comparisons (as of May 9, 2014):
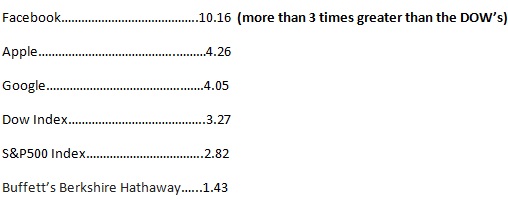
Needless to say FACEBOOK P/B ratio is exorbitantly expensive relative to the rest of the market and its peers. Moreover, by historical standards the entire stock market appears excessively over-valued.
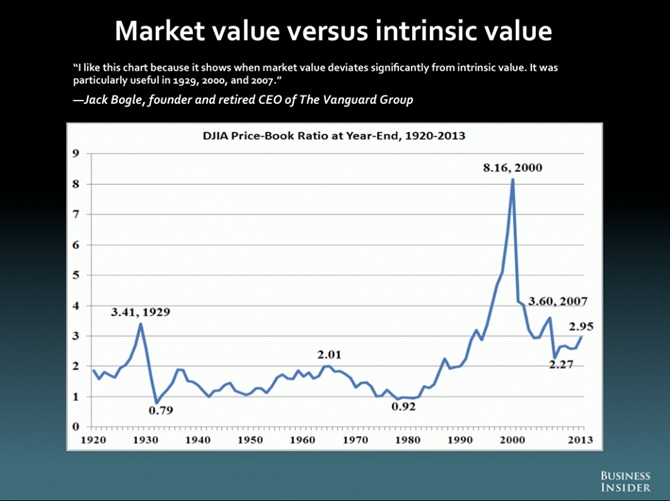
Here is a going away shot at this speculative mania Bubble In Stocks: The chart below paints a poignant picture of Stock Bubbles. It shows the Price to Book Value of the Dow Index from 1920 to 2013. Take particular notice that just before the Great Crash of 1929, the Dow’s Market to Book Value was 3.41. AND TODAY the Dow’s Market to Book is 3.27 (not seen in chart)...just a tad lower than it was in 1929 (i.e. 3.41). Forgive the old cliché: If it smells like a Bubble, and it trends like a Bubble and it looks like a Bubble, then it is most probably A BUBBLE ready to burst (like stocks did in 1929, 2000 and 2007).
 GREED AND COMPLACENCY rein in the stock market today…just as they did in 1929, 2000 and 2007 immediately before horrific bear markets began. It is imperative to remember the Dow Index fell -85% in the 1929-1932 Great Crash, -37% in the 2000-2002 bear market, while the stocks index plummeted -54% in the 2007-2008 debacle. Consequently, the powerful arguments advanced above suggest that instead of a mere bull-market correction, US stocks may well suffer a new secular bear market…as GREED AND COMPLACENCY morph into FEAR AND ANGST.
********


