Intermediate Forecast: Gold, Silver And Mining


 In the last intermediate gold update, posted a month ago, it had become apparent that the 6-month cycle in gold had bottomed and that prices had begun the next rally phase. Gold prices are now approaching the original target area laid out in that update (see charts below) and I wanted to follow up with a quick update. I will begin watching the price structure for signs of topping, and once the February top is confirmed, I should be able to give a more accurate spring forecast. Preliminary analysis suggests the next 6-month cycle will bottom sometime in April or May.
Below is the daily chart from the December 29th update. The extended 43-day cycle did, in fact, herald a brief 10-day cycle that unfortunately terminated short of my original target zone. That 6-month low proved to be somewhat tricky, and I apologize for any missteps I may have taken.

The current daily gold chart is showing that prices are rapidly approaching their intermediate target as well as the 200-day moving average. Prevailing momentum could push prices deep into the target zone challenging the $1,150 level or higher before topping. Once we have a confirmed top in place, I will draw up the April/May targets boxes.

The weekly chart of gold also depicts a rapidly approaching target area near the downward sloping 50-week moving average. The Slow Stochastics (top of chart) is nearing overbought levels, and I will soon begin the process of searching for a cycle high.

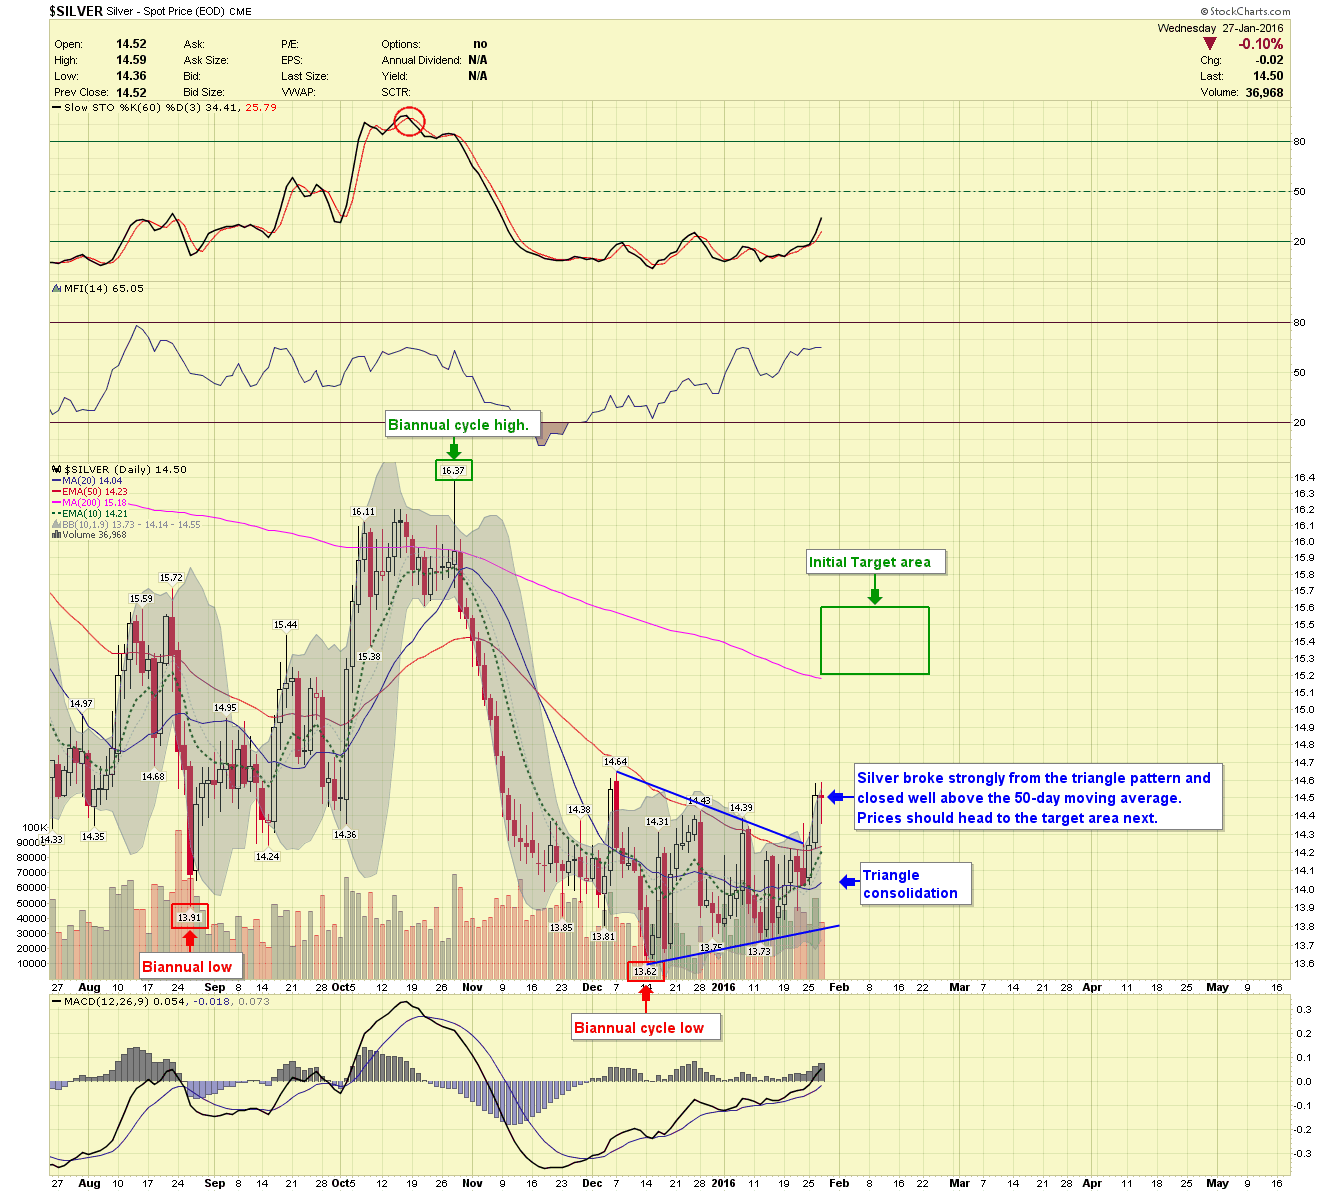
Silver proved to be rather finicky coming out of this 6-month cycle low, prices formed a triangle pattern, and it resolved with an upward bias Tuesday. Prices should now follow gold higher, and top in or around the target area nestled just above the 200-day moving average. Like gold, I’m anticipating an April/May low and will approximate targets once the February top has been confirmed.
The miners proved most difficult this cycle as they displayed relative weakness to gold and silver as they fell to secondary lows. Prices have now reversed and should rally to the target area originally provided in December. Prices will likely head to new lows in April/May with gold once this intermediate cycle tops.

Before I conclude this precious metals update, I wanted to point out something in the CRB index. The Thomson Reuters Core Commodities Index has fallen to levels not seen since 1973. The index is made up of 19-commodities (revised in 2005) consisting of 39% energy, 41% agricultural, 13% base/industrial metals and 7% precious metals. Over the years less liquid commodity contracts such as wool, eggs, lard and rubber were dropped from the original index (1958) that previously covered 28-commodities.
The weekly chart shows prices have fallen to levels not seen in 43-years. Bearish momentum has driven prices far below the 200-month moving average and is now very oversold. Prices could drop a little further from here, but I decline to believe they will stay this depressed for long.

I hope everyone is having a wonderful and healthy new year and please stop by and visit us at www.buygoldprice.com
********
Courtesy of www.BuyGoldPrice.com


