Longest Stock Bull Market In US History…May Finally Be Dead
 share
share
 share
share
 share
share
 share
share
 share
share
The bull market turns 3,560 days old as of last Friday. It's the longest period of uninterrupted stock gains in Wall Street history.
The remarkable run began on March 9, 2009, in the ashes of the Great Recession and the scariest financial crisis since the 1930s.
However, there are indisputable signs that the NYSE has indeed peaked…meaning the record bull may well have died in the infamously historic month of October. Specifically, the S&P500 and DOW Indices have plummeted -10.0% and -9.1%, respectively in merely the past 2 months!
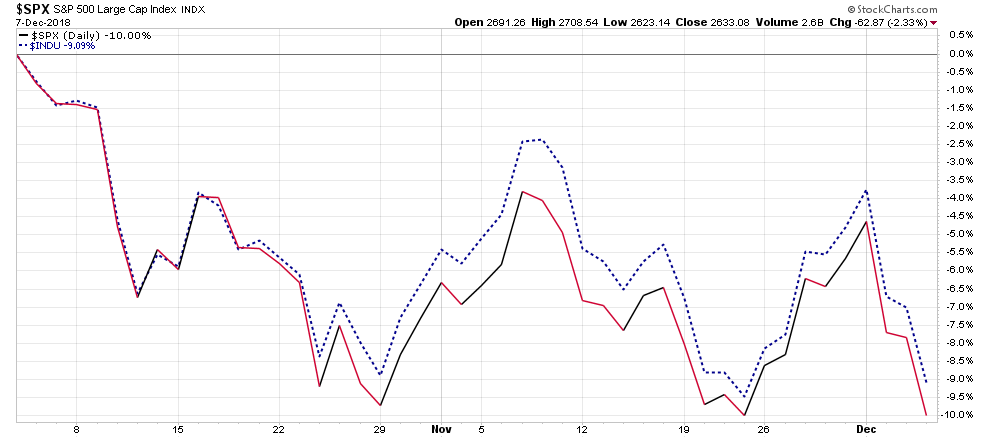
(Source: https://stockcharts.com/h-sc/ui?s=%24SPX&p=D&en=&id=p03046849350&listNum=1 )
Obviously, no one has a crystal ball to exactly forecast what the NYSE will do going forward. Nonetheless, there are indeed red flags indisputably suggesting the all-time record bull is without question excessively long in the tooth (i.e. a BEAR MARKET actually birthed in the infamous month of October)!
Red Flags Suggesting The Bull Is Dead
Recent Price Plunge - Firstly, the horrific decline of -10% in the S&P500 in the past 2 months is indubitably a sign something is dramatically wrong (see above chart).
Death Cross - Secondly, the S&P500 and NASDAQ indexes formed Death Crosses last week…when their 50 DMA crossed down below their 200 DMA (See charts below). And although the DOW’s Death Cross is not yet a fait accompli, it is indeed very close to it.
Significance of the Death Cross:
The Death Cross indicator has proven an accurate predictor of the most severe bear markets of the past century: 1929, 1938, 1974 and 2008. Investors who got out of the stock market at the start of these bear markets avoided large losses that were as high as 90% in the 1930s. Because a Death Cross is a long-term indicator, as opposed to many short-term chart patterns such as the doji, it carries more weight for investors concerned about locking in gains before a new bear market gets underway.
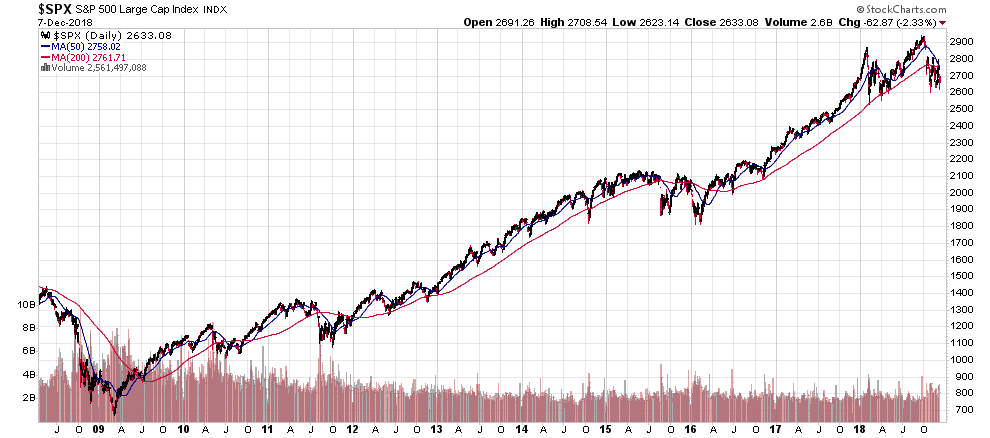
(Source: https://stockcharts.com/h-sc/ui?s=%24SPX&p=D&yr=10&mn=8&dy=0&id=p14305412574&listNum=1&a=634987781 )
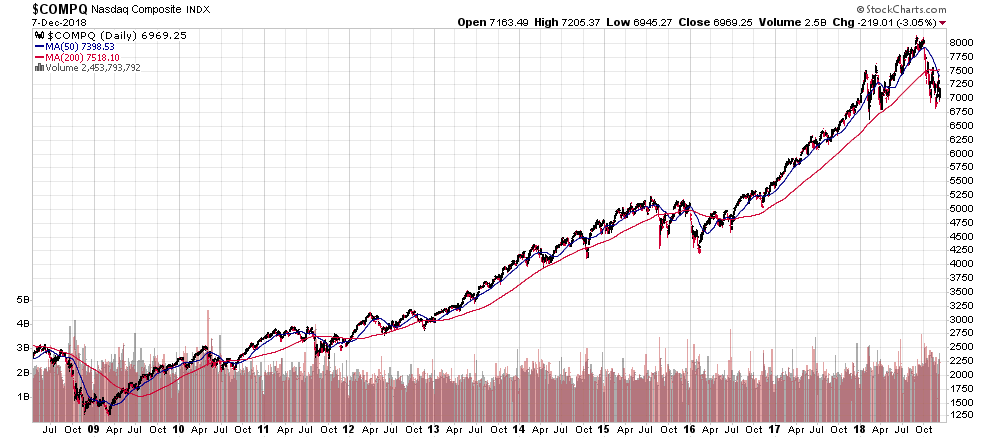
(Source: https://stockcharts.com/h-sc/ui?s=%24COMPQ&p=D&yr=10&mn=8&dy=0&id=p1475770597c&listNum=1&a=634988168 )
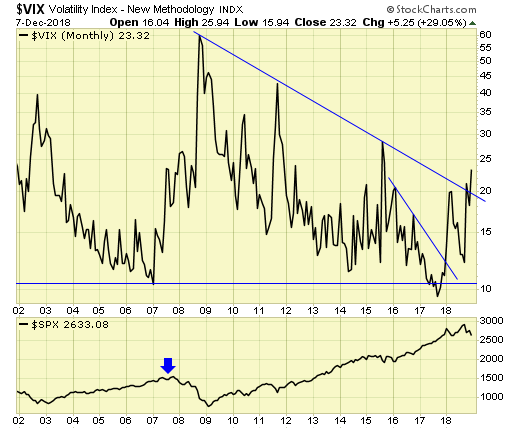
Volatility Index
Volatility value, investors' fear and the VIX index values move up when the stock market is falling. The reverse is true when market advances – the index values, fear and volatility decline. Very recently the Volatility Index spiked upward (as it did in 2007). Indeed the recent upward spike broke its recent years’ downtrend from 2009-2017. This suggests the NYSE stocks will probably enter a BEAR MARKET phase (as it did from 2007 to early 2009 period when stocks declined more than 50%).
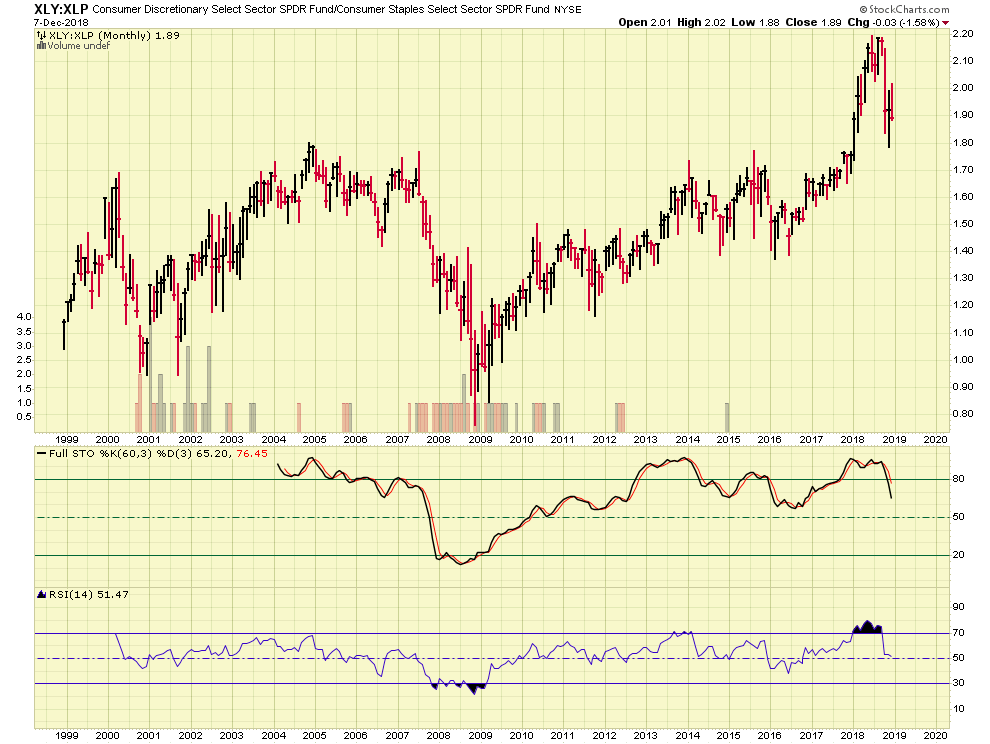
XLY:XLP
This is a very seldom used indicator to accurately identify Stock Market Tops and Market Bottoms. Nevertheless, one can readily see that the XLY:XLP in early 2000 and again in 2007...precisely coinciding with NYSE peaks. NOW Fast forward to late 2018, and again we see that indicator XLY:XLP peaked (and its Technical Indicators of Full Stochastics and RSI have likewise peaked and are heading downward)…thus forecasting much more lower stock values on the horizon.
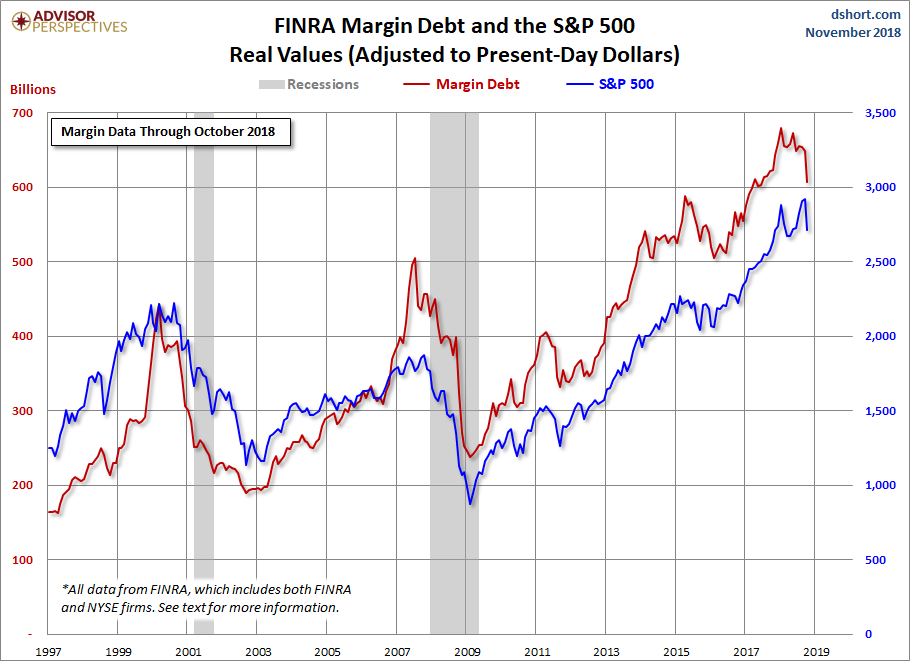
NYSE Margin Debt vs S&P500 Index
In 2001 and again in 2007 NYSE Margin Debt vs S&P500 Index peaked, which heralded the S&P500 over-valuations that marked the beginning of horrific Bear Markets. Well again early this year, this indicator has forged an all-time peak…thus spot-lighting the probable entrance of Mr. Bear. Actually, this Bear Market Indicator has fallen from an all-time record high! Effectively, ignorant US investors have “bitten off” more Margin Debt than they can “chew” (i.e. pay back without massive MARGIN CALL SELLING).
Upshots Of Above Analysis
The longest continuous bull market (previously) lasted 8 years from 1991-1999 (the very small negative performance in 1994 ignored as the amount was too tiny). HOWEVER, the present bull market is also quite long in the tooth…as it has to date lasted nearly 10 years (2009-2018)…ignoring the small negative performance of 2015 as it was too tiny to take into account.
To wit: A material stock market correction is almost inevitable…ergo only magnitude and duration are yet to be determined.
Based upon stock market history since 1929, a Stocks Bear Market inevitably looms on the horizon…in the not too distant future.
This begs the question: How far might stocks fall in the next BEAR MARKET? The following historic data might provide guidelines to help estimate the extent of the next decline in stock prices:
Below is an accounting of all BEAR MARKETS since 1929. For the sake of clarity, a BEAR MARKET is defined by the S&P500 falling at least 20%.
Here is the upshot of BEAR MARKET HISTORY:
-
Since 1929 there have been 25 Bear Markets
-
The average Bear Market period lasted 10 months
-
The average Bear Market loss was -35% (The smallest loss was -21% in 1949, and the largest loss was -62% registered in 1932)
-
Average frequency of Bear Markets since 1929 is every 3.4 years
-
The last Bear Market ended in March 2009. Therefore, another Stocks Bear Market looms - as the present BULL MARKET is quite long in the tooth with approximately 9.7 years to date.
I am reminded of the sage knowledge of Wall Street: Whereas history does not always repeat…it indubitably rhymes (i.e. history provides lines of probability). Consequently, the next bear market in stocks may well dumbfound the delusional Pollyannas who are blind-sighted by their own insatiable greed.
Irrational Exuberance Par Excellence
 The current BULL MARKET in stocks is the greatest and longest in history. Since early 2009 the S&P500 Index has relentlessly soared about 300% to date. Consequently, excessive investor greed will sooner or later morph into fear…thus sparking and fueling a frenzied panic sell-off as fleeing investors stampede out of the financial carnage.
Needless to say it’s time to be FEARFUL AS THE BEARS ARE AMASSING IN WALL STREET!
share
share
share
share
share