US Treasuries Bear Market Prediction


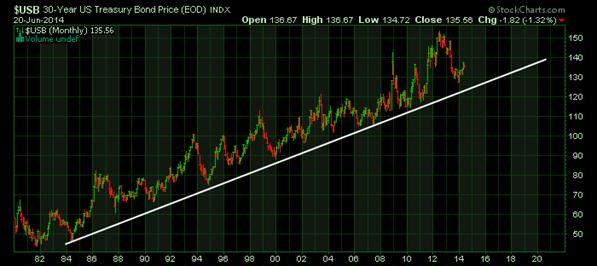
 We predict a Bear Market in US Bonds is brewing on the horizon. Our analysis will encompass many compelling factors forcing most rational investors to agree. However, one of the most convincing arguments for an approaching US Bonds Bear Market is the fact that T-Bonds have heretofore enjoyed an unprecedented and uninterrupted 33-year Bull Market (1981-Present). However, everyone knows all Bull Markets of any asset class eventually and inevitably end…and to be sure this bull is already very, very long in the tooth.
An Unprecedented 33-year Bull Market in US T-Bonds
The China Factor
The second most important factor suggesting T-Bonds are headed for a tumble is The China Factor. Today the Sino nation is the world’s largest holder of Uncle Sam’s Debt paper…as The Peoples Bank of China has more than $1.3 Trillion in US Treasuries.

China Will Soon Panic
An expert on US Treasuries and China recently made the following observations: “China just sold almost $50 billion in US Treasuries… But don’t panic just yet
China’s holdings of US Treasuries dropped to the lowest levels in two years after China dumped $47.8 billion in paper—equal to about 3.6% of its Treasury holdings as of November—bringing its total holdings to $1.27 trillion. Not that this should come as a shock. Yi Gang, a deputy governor of China’s central bank, hinted at the move when he announced in late November that the country no longer benefits from increasing its foreign reserves.” Source:
http://qz.com/178532/china-just-sold-almost-50-billion-in-us-treasurys-but-dont-panic-just-yet/

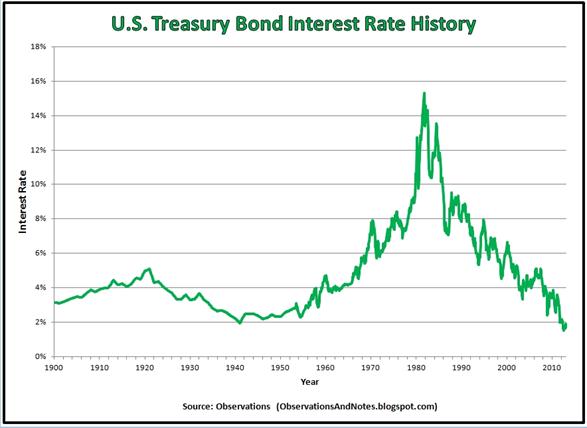
US Treasury Bond Interest Rates At A 114-Year Low
The astounding chart below shows that the Fed has successfully forced T-Bond Interest Rates to lowest level since 1900. Only once in all this time did rates reach the 2% level…and that was in 1940 (just before World War II broke out). Indubitably, this cannot be good for the US economy.
Long-Term Interest Rate Symmetry
Curiously, the 10-Year Treasury Note Rate chart demonstrates fearful symmetry. But on the other hand it might imply interest rates may well be bottoming out…and will soon begin to rise again. And in this event, bond prices will tumble accordingly.
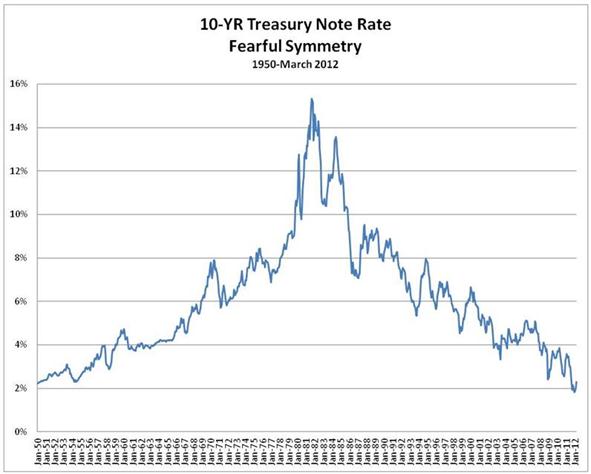
Source: American.com
http://www.american.com/archive/2012/april/fearful-symmetry-six-decades-of-treasury-yields
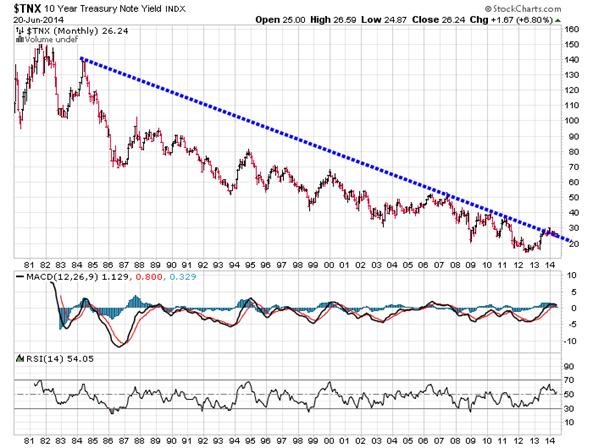
Interest Rates May Have Recently Bottomed
The next chart of the 10-year Treasury Note shows that recently the interest rate trend was penetrated upside. This may be the first indication that all Treasury Prices may finally be topping out:
--------------
CONSEQUENTLY, if interest rates shoot up, the iShares 20+ Year Treasury Bond ETF (TLT) will get hammered.
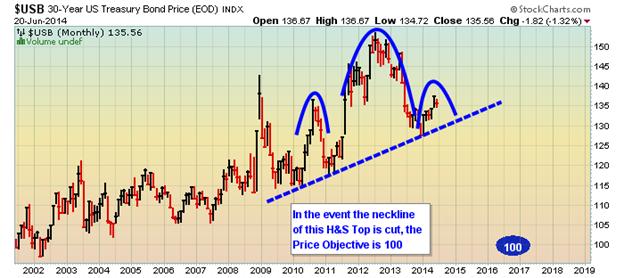
Notice bearish Head&Shoulders formation. In the event the neckline is cut, the theoretical price objective would be about 75 support level (2008-2010).

US Prime Rate is below the Great 1930s Depression Levels

Today’s Prime Rate is 3.25% according to the WSJ.
Historic Bear Market In Treasury Bonds
To have an idea how much T- Bonds can fall in a rising interest rate environment, let’s look at what happened in the 1977-1981 period. During this brief period the 30-Year Treasury plummeted -46% from 104 to 56…all while the Dow Index hugged the 800 level.
We might expect similar results going forward…as interest rates are obviously already in the basement. And some market pundits observe that any further lowering of interest rates may plunge the US Economy into another Great Depression…a la 1930s. But the Fed’s Janet Yellen is too smart to allow that scenario to materialize. Au Contraire, Dr. Yellen will most probably help fuel accelerated economic growth by pushing up interest rates. Subsequently, T- Bonds will inversely decline in value.
30-Year T-Bond chart shows Bearish H&S Top with price objective of 100
SUMMARY: 9 Valid Reasons To Anticipate A Bear Market In T-Bonds:
- Unprecedented 33-Year bull market in T-Bonds
- China Factor will eventually dump T-Bonds
- 10-year yield appears to be rising
- Today’s 30-Year US Treasury Bond rate is at the same abominably low level it was in 1940 (chart)
- Long-term price symmetry of Treasury Rate
- Correlation with T-Bond prices in period 1977-1981 when the 30-Year Treasury plummeted -46% from 104 to 56…and while the Dow Index hugged the 800 level
- 20+ Year Treasury Bond ETF (TLT) is forming a bearish H&S Top pattern
- US Prime Rate is at a 77-year low…1930s Great Depression Levels
- 30-Year T-Bond chart shows Bearish H&S Top with price objective of 100
------------------
US Treasuries Bear Market Prediction

 Based upon all the above data and rationale; and assuming interest rates will rise at the same rate they did in the 1977-1981 period, US Treasuries might fall to 100 (from today’s 136).
*******


