Latest Gold Price Forecast & Predictions
Gold Price Now:
USD
$5,278.11
0.00
0.00%
Recent Changes
| Period | 2 Days | 3 Days | 1 Week | 2 Weeks | 1 Month |
|---|---|---|---|---|---|
| Change | +1.87% | +1.71% | +3.36% | +4.69% | +1.38% |
Gold Price Forecasts - Analyst Predictions
Gold-Eagle has been analyzing gold markets and publishing gold price forecasts for over 23 years. Our staff and contributing analysts include world reknowned precious metal experts and market analysts. The gold price forecast data below represents the average predictions of a diverse panel of expert gold market analysts. Their assessments of gold price trends are based on a variety of methods including: expert technical analysis, market fundamentals, current market sentiment, and an analysis of global economic and political events. Bookmark and/or link to this page to check back every week. Updated every Monday am.
Last Updated: December 06, 2025
Gold Forecast Short Term
Bullish
Price Drivers for next 6 weeks:
resistance at $4,200, markets, geopolitical uncertaintyGold Forecast 1 Year
Bullish: $4,650
Medium-term price drivers:
US dollar, bear market in stocks, geopolitical situation, economic uncertaintyGold Forecast 3 Years
Bullish: $5,500
Long-term price drivers:
US dollar, monetary debasement, geopolitical uncertaintyFeatured Gold Price Forecasts
 Gold and silver tumbled to start February, but the uptrends remain intact, supporting the case for new highs in the second quarter.
Gold and silver mining stocks are posting fresh highs and are likely to continue leading the metals complex higher in the months ahead.
In September 2023, we noted that gold was shaping a “launch pad” pattern with the potential to drive prices toward $8,000. Today, that target seems increasingly conservative.
In our Big Picture Gold Update, we forecast a move toward $8,000+ and highlighted that this could be one of the final opportunities to purchase gold below $2,000. Prices are approaching that target sooner than expected, and levels in the $12,000 to $15,000 range are increasingly plausible.

Current Analysis
GOLD: Gold dropped $1,200 in three trading days, yet it never closed below the 50-day EMA or registered a weekly swing high, confirming that the broader uptrend remains firmly in place.
We expect new all-time highs in the second quarter, likely topping in May, with the risk of a 1979-style blow-off rally...
Another big bank has raised its gold forecast.
This time, it’s JPMorgan expressing more bullish sentiment despite the recent correction.
The big bank raised its 2026 gold forecast from $5,055 per ounce to $6,300.
JPMorgan analysts note that the 11 percent correction late last month ranks alongside some of the largest down days in gold's history, including January 1980's 13 percent fall and the 12 percent slump in February 1983.
However, they emphasize gold bugs shouldn’t be worried.
"Even with the recent near-term volatility, we remain firmly bullishly convinced in gold over the medium-term on the back of a clean, structural, continued diversification trend that has further to run amid a still well-entrenched regime of real asset outperformance vs. paper assets."
JPMorgan analysts also lay out a case for $8,000 gold if households meaningfully increase their allocations. This underscores that while gold may become oversold at times, it is still significantly underinvested.
There has been growing interest in gold as a portfolio diversifier. Last fall, Morgan Stanley CIO Michael Wilson said investors should consider abandoning the traditional 60/40 equity/bond portfolio allocation and adopt a 60/20/20 distribution with 20 percent allocated to precious metals.
...
 From the comments made in past months, Gold's larger rally phase was projected to hold up into February of this year, plus or minus, though with the recent 'mini-panic' drop well overdue in the Gold market.
Gold's 10-Day Cycle
For the short-term picture, our smallest-tracked wave in the Gold market is the 10-day cycle, which is shown on the chart below:
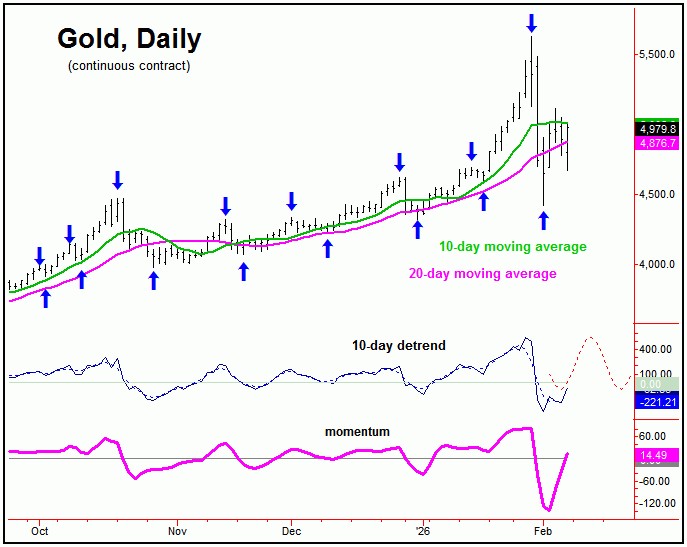
From my 1/25/26 article: "our 10-day wave is now 4 trading days along, with the average rallies having taken some 4-7 trading days before topping. With that, the next short-term peak - and correction - should come from this cycle, which is next projected to trough into early-February, plus or minus."
As mentioned above, back on January 25th our 10-day wave was 4 days along, with the average rallies having taken 4-7 trading days before topping. From that article, price went on to spike another 600 points in the following days,...
More Gold Price Forecasts
In October, Bank of America raised its 2026 gold price forecast to $5,000. Mission accomplished as of January 23. Now the big bank has upped its projection again, calling for $6,000 gold this year.

From the comments made in past months, Gold's larger rally phase was projected to hold up into February of this year, which favored each of the in-between corrections to end up as countertrend. With that, we are moving into the range where a key peak is expected to...

As mentioned in my last article back in late-December, Gold was setting up for a key short- term correction, coming from several smaller tracked waves - though a move anticipated to end up as countertrend, before turning higher again into February. This February, 2026...

Gold investors: the fourth turning is upon us. Yes, that is right – a signal so rare, so powerful, and so ominous that it has appeared only three times in the last 130 years – has now shown itself.

As mentioned in my last article back in late-November, Gold was looking for a short-term decline with our 10-day wave, a move which was anticipated to end up as countertrend. Stepping back slightly, another correction is coming due for the metal, also favored to end up...

Since my last article for Gold-Eagle, both the Gold market - and U.S. stocks - have seen correction phases, though with each of these having been expected to end up as countertrend moves - against the larger upward phase. We will take a look at each of markets this...

Gold is pausing near $4,200, and if this is a B-wave bounce, I’d expect to see prices begin to roll over soon. Silver tested the October high and then reversed. A close below $52.00, with follow-through under $51.00, would signal a potential reversal.

Gold has had a massive run for 2025, up 53% or nearly $1,400 since January, when it traded at $2,600 per ounce. Gold recently made a new all-time high at $4,381 in the spot market in October.

Gold peaked one trading day after we issued our Blow-Off Top Warning. A repeat of the 2006 pattern suggests a potential decline toward $3,500 in November.
Gold Price Forecast FAQ
How do you forecast the price of gold?
Predicting gold prices can be said to be both a science and an art. For example, analysis of gold supply and demand is scientific and completely objective whereas aspects of technical and sentiment analysis of the current gold market can be more of an art as it relies on the skills and perspective of the gold analyst.
Generally speaking, when the focus of the gold forecast is longer term then analysis of the fundamentals, ie scientific analysis, comes to the fore.
For shorter-term predictions of gold prices, the price of gold in the coming weeks and perhaps few months, technical analysis of past and current gold prices, market trends, as well as current market sentiment can be more actionable predictors. Here, the fundamentals can still play a role but generally serve more as background details.
What are the key factors for long term gold forecasts?
When forecasting what may happen to the price of gold longer term, there are many things to consider including economic trends, the impact of current and expected monetary policy, QE, debt monetization, and the aggregate impact on future currency valuation.
Does the price of gold go up when the stock market goes down?
The price of gold is often negatively correlated to the stock markets. When the markets go down, gold prices usually go up. However, this is not always true. Sometimes the price of gold and stocks both go up and down in unison. Fundamental factors play an important role and need to be carefully analyzed. Historically, however, the price of gold is not tied to the fluctuations of stock and bonds. This is one of the chief reasons when one should have gold in their portfolio – to protect the long-term value of your investments.
Does the value of the US dollar predict the price of gold?
As gold is traditionally quoted in US dollars, the price of gold is negatively correlated to the strength of the USD. The weaker the US dollar, the cheaper it is to purchase gold. Therefore, if economic factors predict a strengthening of the US dollar then this will tend to drop the price of gold, and vice-versa. According to the statistics (since 1973), the long-term correlation between the U.S. dollar index and the gold prices is -0.6 so this link is quite strong.
How do US interest rates impact future gold prices?
The level of US interest rates is an important driver of future gold prices. When investing in gold, the investor is faced with the opportunity cost of gold - a non-interest bearing asset. The higher the US interest rate for holding US dollars or investing in Treasuries, the higher the opportunity cost of holding gold. It is more likely, therefore, that a rally in the price of gold will be forecasted the lower the US benchmark interest rate.
Gold Forecast Analysts

Technical Analysis Expert & Editor @ GoldPredict.com
AG Thorson is a registered CMT through the MTA and an recognized expert in technical analysis of the precious metals markets. He is also the Editor of GoldPredict.com where members receive daily updates and regularly scheduled reports 3-days a w More...

Chief Analyst & Founder @ iGold Advisor
Christopher Aaron began his career as an intelligence analyst for the CIA and Department of Defense. He served two tours to Afghanistan and Iraq between 2006 - 2009, conducting pattern-of-life mapping for military leaders.Mapping shares similarities More...

CFA, Editor & Founder @ Sunshine Profits
Przemyslaw Radomski, CFA, is the founder, owner and the main editor of SunshineProfits.com. You can reach Przemyslaw at: http://www.sunshineprofits.com/help/contact-us/. More...
Seventy-five percent of all gold in circulation has been extracted since 1910
Latest Gold Analysis

