Gold Forecast: Current Gold Cycle Positioning


 With the action seen in recent months, Gold has continued to play out with the bigger bullish trend, coming from the bigger four-year cycle. That trend is favored to hold up into early 2026, before topping the metal for a larger-degree decline into later next year.
Gold's 10-Day Cycle
For the short-term picture, we can take a look at our smallest-tracked wave, the 10-day cycle in Gold:
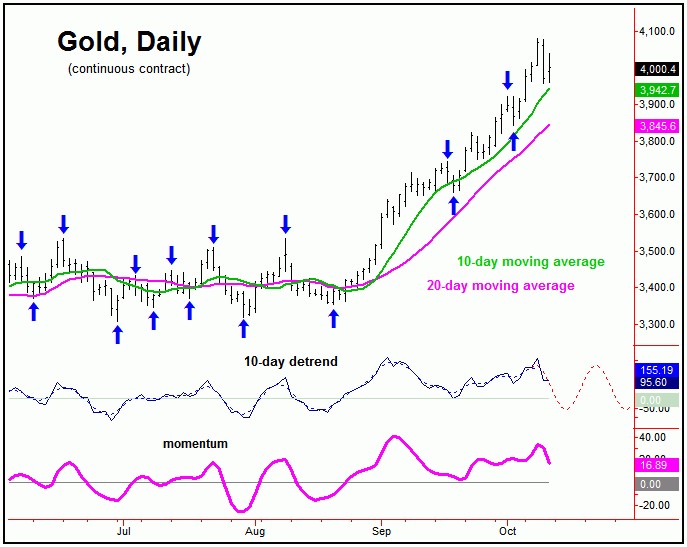
The upward phase of our 10-day wave (chart, above) is currently deemed to be in force, though with the next smaller-degree correction expected to come from this wave. In terms of price, any push below the 3953.40 figure (December, 2025 contract) would infer its next downward phase to be in force, with the detrend that tracks this cycle projecting its next trough to form around mid-October.
In terms of patterns, the next correction phase of this 10-day wave could well end up as a countertrend affair, due to the position of our larger 72-day cycle, which is the most dominant cycle in the Gold market, and is shown on the chart below:
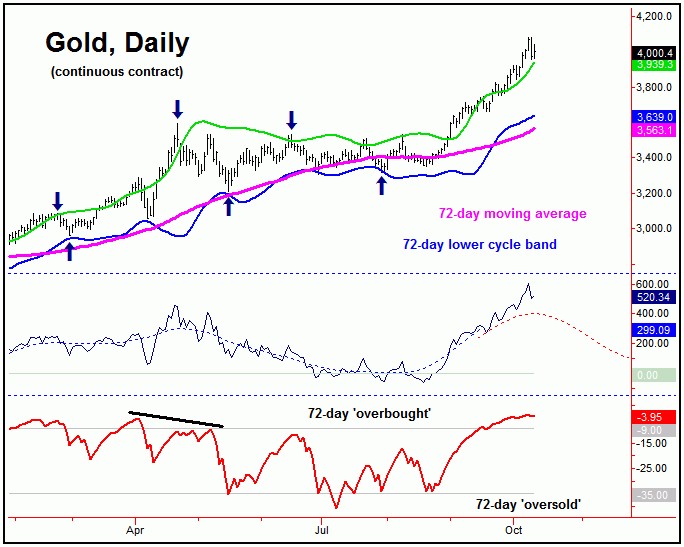
As mentioned in our September 8th, 2025 Gold Wave Trader report, this 72-day cycle confirmed a very early bottom, doing so at the late-July trough of 3319.20. This action has since given way to over 400 points of additional rally (from that 9/8/25 close).
With the above said and noted, the next peak of real significance expected to come from this same 72-day cycle. Its next trough - if made on schedule - is now projected for the late-November window, plus or minus, though with more recent bottoms having formed on the early side.
In terms of price, the next correction phase of this 72-day cycle has the potential to drop back to the lower 72-day cycle band, as well as to the 72-day moving average - each of which are well below current price levels. Having said that, these areas are also rising each day, and will obviously be at higher levels by late-November.
Technical Considerations
With the currently-viewed position of our 72-day cycle, it is a good idea to take a look at a key technical/momentum indicator that we track, called the Gold Timing Index, and which is shown on the chart below:
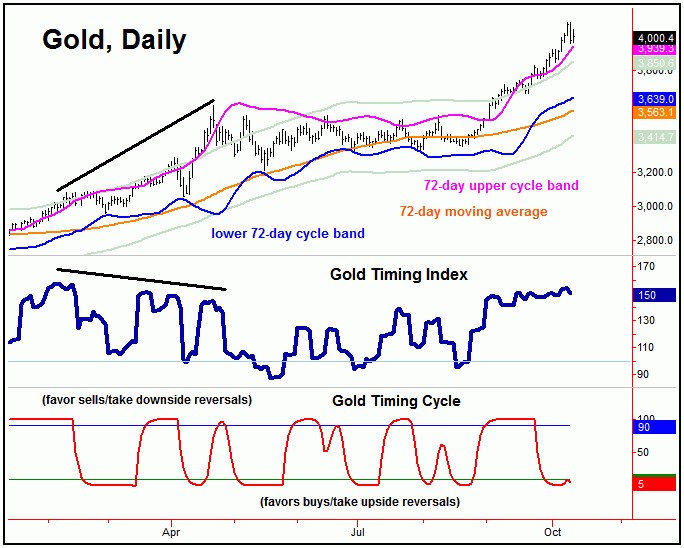
Of particular note with the above is that, at 72-day (or greater) cycle tops, this Gold Timing Index tends to diverge from price action - which it has yet to do. Having said that, this is developing, and could set itself up in the coming days/weeks.
Of additional note is the indicator shown in the lowest pane, in red. This is our Gold Timing/Cycle indicator, which last dropped below its lower reference line (i.e., buy signal), doing so at the 9/29/25 close of 3855.50 (December, 2025 contract). This action supported the most recent rally for Gold, as it did back in mid-August of this year - where it also dropped below its lower reference line.
With the above, the Gold Timing/Cycle indicator is now trying to move from out below its lower reference line. Normally, it takes several days or more to push back above its upper (reference) line, which - if seen - would be a short-term negative indication, and could support the idea of an eventual 72-day peak forming for Gold.
The Four-Year Cycle in Gold
In terms of patterns, the next correction phase of our 72-day wave is anticipated to end up as countertrend, due to the position of the largest-tracked cycle in Gold, the four-year component.
Here is that four-year cycle in the Gold market:
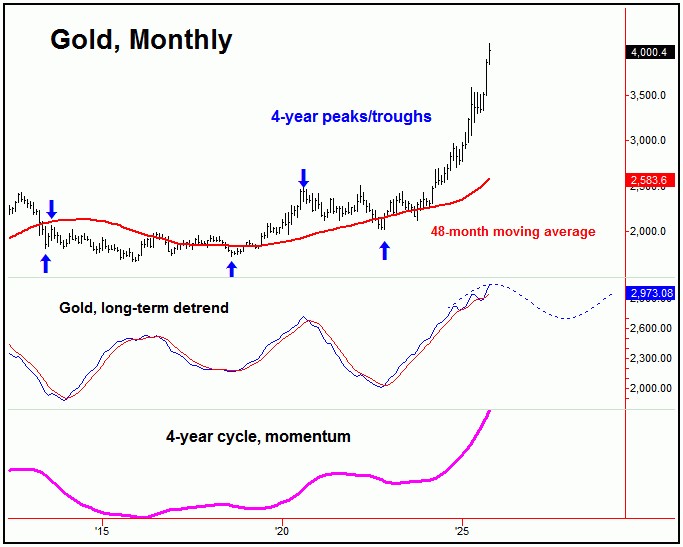
As mentioned in some prior articles back in August of this year, Gold had the potential to each up to the 3800-4000 region before topping this four-year cycle, for what is (eventually) expected to be a larger-degree decline.
With a cycle having a strong tendency (i.e., 85% probability) to revert back to a moving average of the same length, the 48-month moving average will act as a magnet to the next downward phase of this four-year cycle, which is obviously well below current prices. Having said that, this average will be at considerably higher levels by the time this wave next troughs, and is something to bear in mind.
For the bigger picture, the next correction phase of this four-year wave is anticipated to end up as countertrend, holding well above the November, 2022 low, its prior trough. If correct, the next upward phase of this largest cycle should turn sharply higher again into the 2029-2030 (yearly) window; more on this in future articles.
Jim Curry
The Gold Wave Trader
Market Turns Advisory
http://goldwavetrader.com/
http://cyclewave.homestead.com/
********


