Gold And Silver Price, Crude Oil And S&P500 Ending Large Wedge Patterns


 Gold and silver prices have been trading in declining wedge patterns since 2011. Crude has traded in a flat to down wedge pattern for five years, and the S&P has been moving inexorably higher since early 2009 in a contracting wedge.
There are signs of a trend change. Examine the log scale weekly charts below.
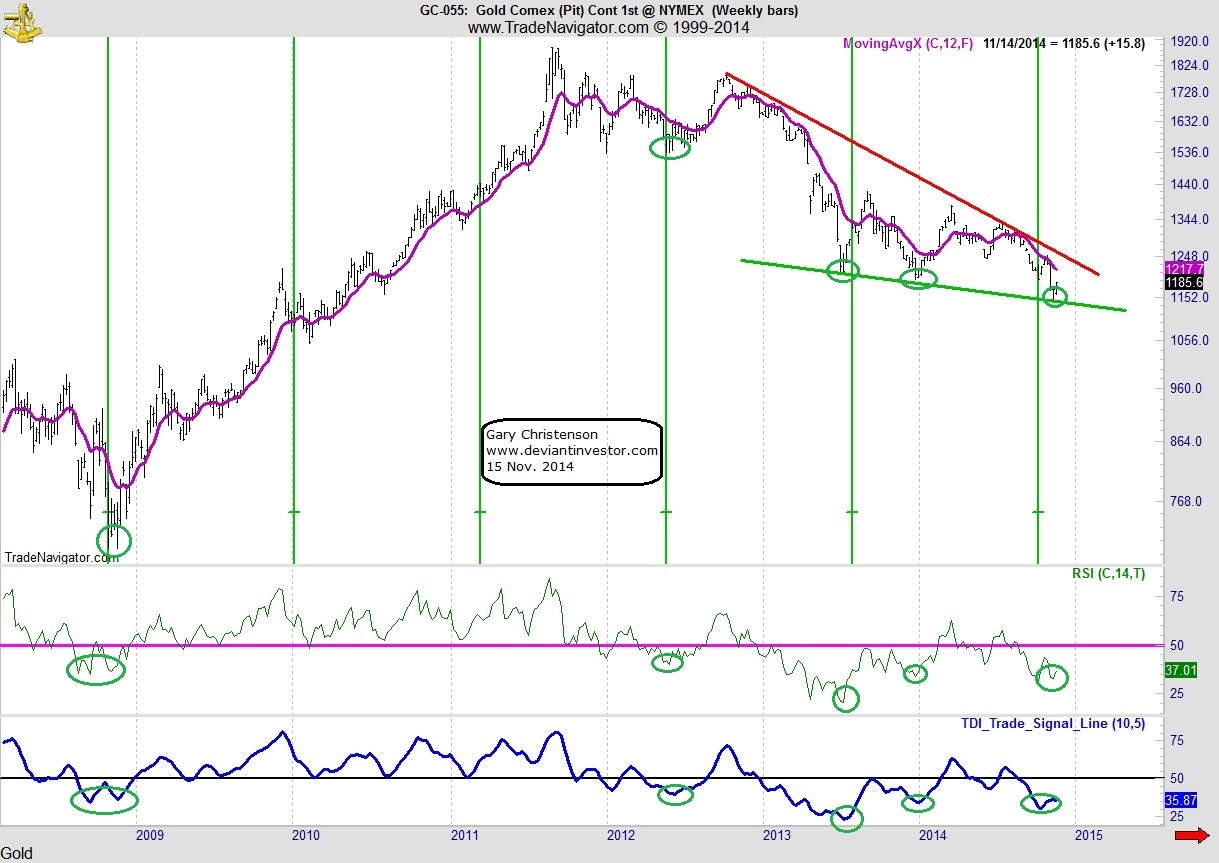
Gold prices (above) show a declining wedge pattern with prices currently bouncing off the lower trend line while the RSI (Relative Strength Index) and the TDI Trade Signal indicators are indicating buy signals on the weekly chart. The bounce on Friday the 14th was encouraging. The vertical green lines show very rough 62 week cycle lows that also suggest now is an reasonable time for a low. The weekly trend has been down but a break of the red line at about $1225 would suggest this bottom will finally hold. My estimate is that the price bottom occurred over a week ago.
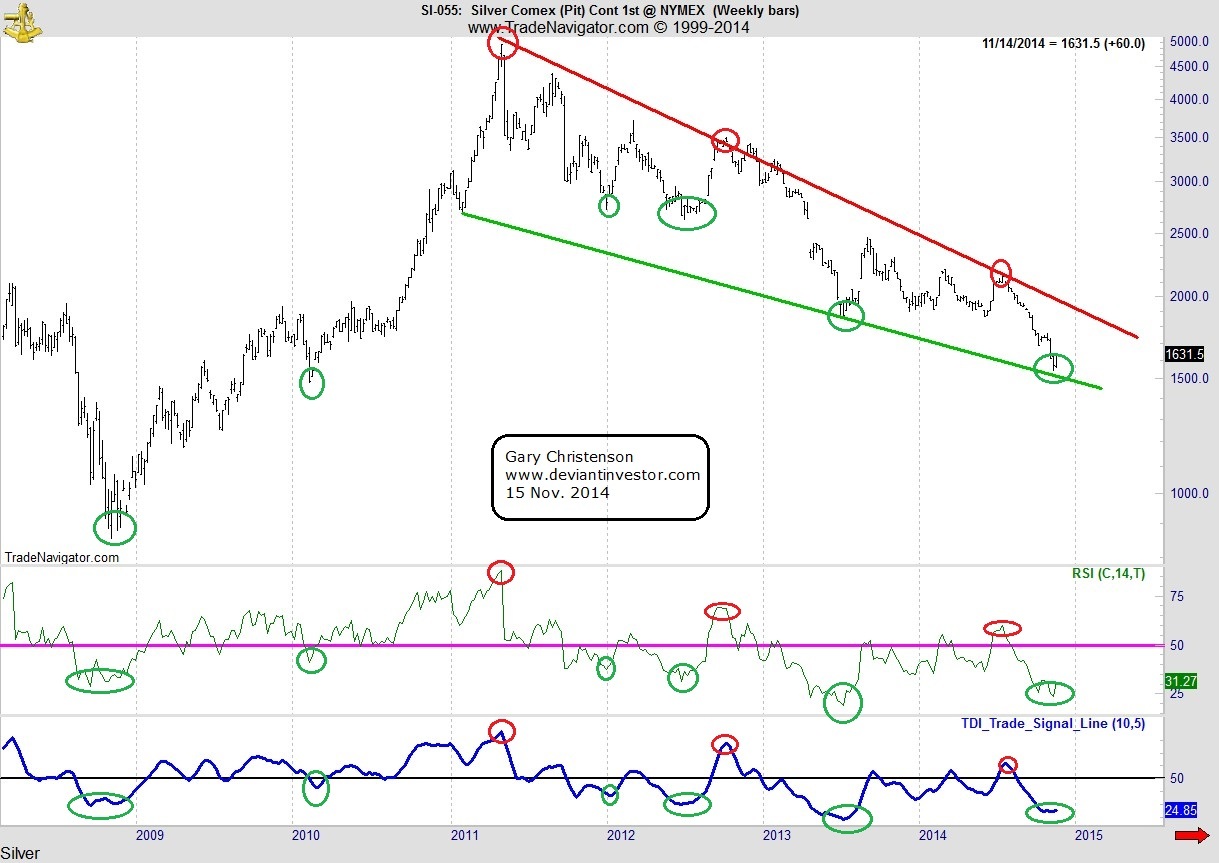
Silver prices (above) show a similar declining wedge pattern from May 2011. Since then prices have dropped about 70%. The RSI and TDI are deeply over-sold and Friday’s bounce was quite encouraging. Similar to gold, the weekly trend has been down but a break above $18 or $19 would probably indicate a sustained rally. My estimate is that the bottom occurred over a week ago.
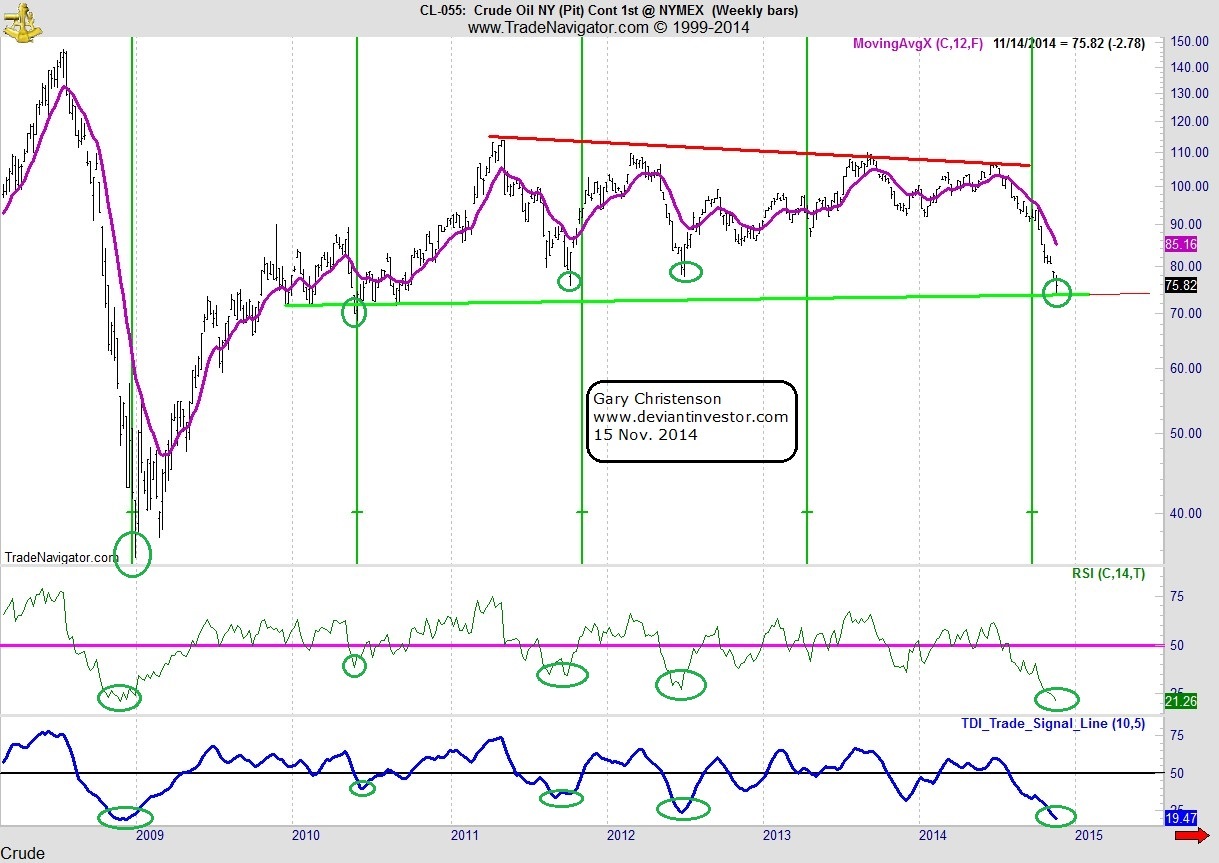
Crude oil has been trading flat to down since early 2010. The recent drop from over $100/bbl to the middle $70s was a shock to many people. The weekly RSI and TDI have fallen to six year lows and indicate a deeply over-sold market. The green vertical lines are approximate cycle lows. My estimate is that crude oil is at or near a major bottom.
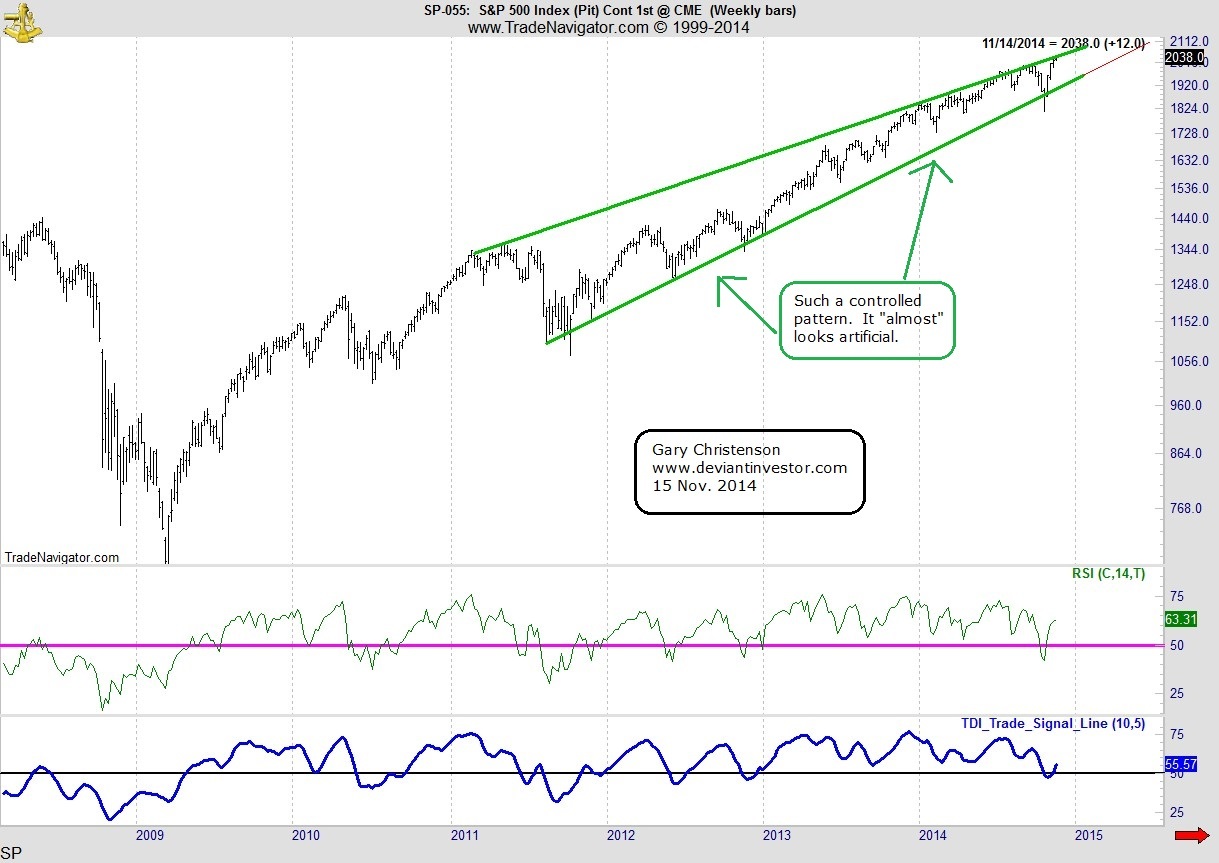
The S&P500 Index has been rising since early 2009 in an almost correction free rally since early 2011. The rise looks so perfect that one might think it was “manufactured” or “managed.” QE is a wonderful thing if you are long S&P stocks or want to sell the “recovering economy” story. Expect the crash when/if it occurs to be truly ugly … or perhaps the S&P can rally another 1,000 points in a perfectly engineered rise that confounds all bears and sets up an even bigger crash. Take some chips off the table.
CONCLUSIONS
Gold and silver look like they have bottomed – again. Perhaps this time it will be a real bottom instead of another fake-out like December 2013 and June 2014. Demand is strong for physical gold and silver, but the supply of naked paper shorts on the COMEX is even larger. This will change. I see prices under $20 as a strong buy zone, since I believe that $100 silver is only a few years away.
Crude oil has crashed by about 30% in the last five months. The charts show what could be an important bottom. One would think that increasing conflicts in Iraq and the Ukraine would support oil prices.
The S&P500 Index has powered higher for 5 years with only minor corrections. The “Greenspan/Bernanke/Yellen Put” has levitated the market to a very high level. It looks like a danger zone to me.
********
The Deviant Investor
 Gary Christenson is the owner and writer for the popular and contrarian investment site Deviant Investor and the author of the book, “Gold Value and Gold Prices 1971 – 2021.” He is a retired accountant and business manager with 30 years of experience studying markets, investing, and trading. He writes about investing, gold, silver, the economy and central banking.


