Gold Forecast: Gold Prices Will Rally Back To New All-Time Highs


Last week's trading saw gold market continuing to remain weaker, with the metal dropping all the way down to a Wednesday low of 1874.20 - before giving way to a decent bounce into Friday's session.
Gold Overall View
The action in recent weeks has seen gold pushing all the way up to a high of 2089.20 - made back on August 7th. From there, a sharp decline of over 200 points - about 10% off the top - was seen into last week. Having said that, the recent move down is favored to end up as a countertrend affair, due again to the position of the larger- degree cycles that we track.
Most key for the coming months is the 310-day cycle, which is shown again on the chart below:
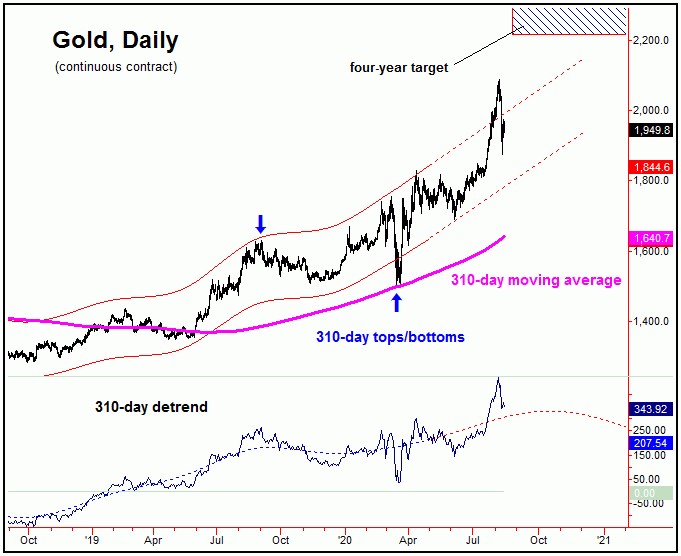
For the mid-term picture, the 310-day cycle is deemed to be heading higher into later this year. In terms of price, there is an open upside target with this wave to the 2212.00 - 2340.56 region for gold. This target has an 85% probability of being met, and with that the assumption is that the current decline off the top will end up as an eventual countertrend affair.
With the above said and noted, anyone with a mid-term mindset should be looking for indications to buy the market, in the anticipation of an eventual move into the 2212.00 - 2340.56 region in the coming months. Even said, that target range does not tell us how far the current decline will carry, though the indications we are getting suggest it could hold up into later this month.
Going further, there are a couple of observations that can be made with our 310-day chart. The first one is that, in a bullish trend, the peaks for the wave will tend to be made on or past the mid-point of the detrend's projected path. That mid-point is shown for the mid-to-late October timeframe of this year, and with that we should expect the soonest this wave to peak being that particular timeframe.
The second observation in regards to the above is that our extrapolated 310-day cycle channel suggests support for any larger decline around the lowest channel line - which is currently at the low-end 1800's for gold. Thus, should the recent decline have further to run, we should be looking for key mid-term support around that level.
The Short-Term View for Gold
From the comments made in my prior article, I mentioned that the short-term picture did favor additional weakness into last week - due to the configuration of our 10-day cycle, which was the most extended in several years. Here again is that 10-day wave:
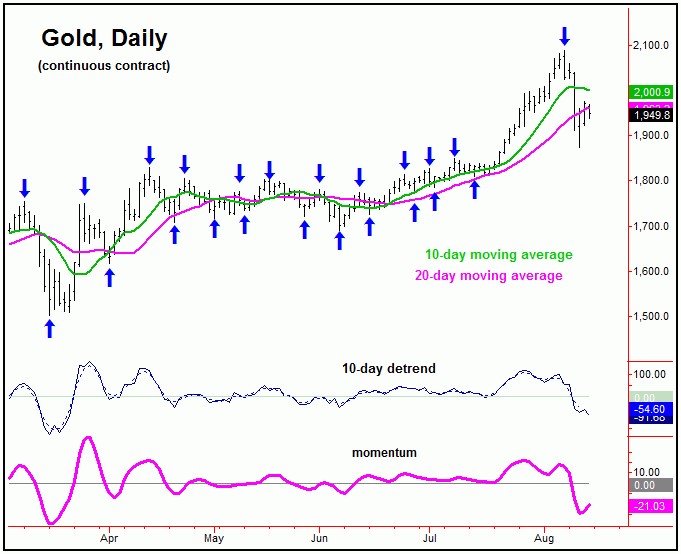
In terms of price, our downside ‘reversal point’ for this component was noted as being the 2040.00 figure (December, 2020 contract), and - once taken out to the downside - was the trigger for the weakness seen into last Wednesday, with the metal dropping a further 160 points through that level.
With the above, our 10-day wave looks like it bottomed in Wednesday's session, even though we have yet to actually confirm the same. If correct, however, the ideal path for the near-term would favor a bounce back to the 10-day moving average, a move which would be favored to end up as a countertrend affair - giving way to a push back to or below the lows again in to later this month.
Stepping back then, lower lows into later this month would be a good spot to be looking for the larger countertrend decline to bottom, with the month of August also being the normal seasonal bottoming window for gold, with more precise details noted in our Gold Wave Trader market report.
Technical Indications
Supporting the recent correction was the position of our Mid-Term Breadth index, which started to turn south back in late-July, doing so off a divergent price high:
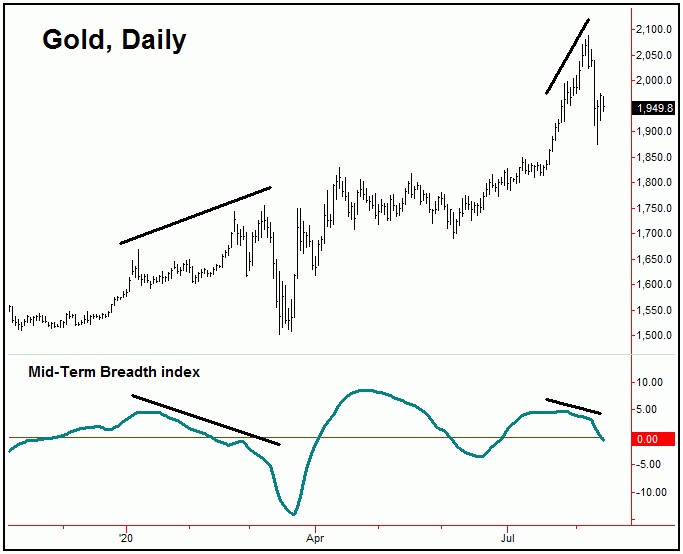
With the above said and noted, our Mid-Term Breadth index continues to push lower at the present time, and will take a move back to the upside to turn the technical trend of breadth higher. Having said that, this indicator is a lagging signal, and won't turn until after gold forms its bottom - and begins to head higher. This is something we will be keeping a close eye on in the days/weeks ahead, particularly into the latter part of this month.
U.S. Stock Market
As mentioned in recent weeks, the next good correction phase is expected to come from our 45-day cycle in stocks - with the current upward phase being at or well into extended territory. Here again is that 45-day cycle:
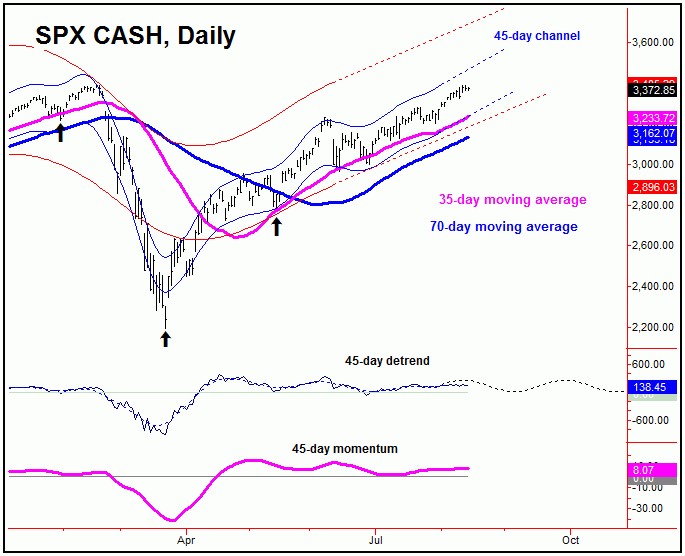
In terms of time, this wave was originally projected to bottom around the middle part of this month, though the recent action has pushed its forecast path to a low due around late-August to very early-September. In terms of price, the probabilities will favor an eventual round-trip back to the 35-day moving average as it bottoms, though with at least the potential for that decline to reach on back to the lower 70-day moving average.
In terms of patterns, however, any decline with the 45-day wave is expected to end up as countertrend, holding well above the June trough of 2965.66 SPX CASH. If correct, higher highs are expected to play out into the early-Autumn timeframe - before the next mid-term peak is projected to unfold for U.S. stocks. More on all as we continue to move forward.
Jim Curry
The Gold Wave Trader
http://goldwavetrader.com/
http://cyclewave.homestead.com/


