Gold Market Update


Although a major precious metals sector bullmarket has certainly started, various fundamental and technical factors came together last week to suggest that a significant correction to the recent strong run-up has now started.
The main fundamental development was the announcement that there will be a Trade War summit between China and the US early next month, with hopes being expressed that this may lead to compromise or some kind of truce. Whilst the chances of improvement may be slim, the market has got what it wants for now which is hope, and this hope should continue at least until this meeting, which provides the excuse for the markets to go “risk on” until then, which is why the stockmarket broke higher last week, delaying but not eliminating our crash scenario.
A return to “risk on” is clearly not good for the Precious Metals which, until last week, had been benefitting from a flight to safety as had the dollar, creating the unusual situation where the dollar and gold were rising at the same time. Now, in a risk on environment they are suddenly out of favor again.
In addition to this fundamental argument we have a range of technical indicators pointing to a correction in the Precious Metals sector that we will now look at. They include its overbought status, overly bullish sentiment readings and COTs showing extreme readings.
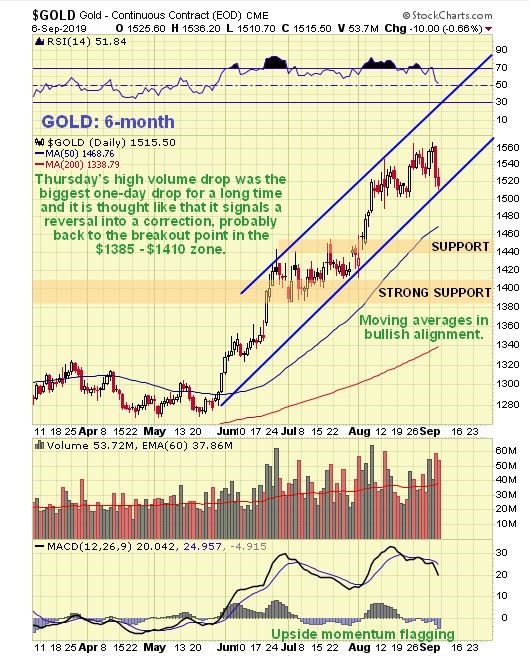
Starting with gold’s 6-month chart, we can see that it doesn’t look too bad – yet, but if we look more closely we can see that it is on the point of breaking down from the rather steep uptrend in force from late May, with it having dropped back on quite high volume the past 2 trading days, and it is noteworthy that Thursday’s drop was the biggest 1-day drop for a long time, making it more likely that it signals a reversal. In addition, the MACD indicator shows that momentum is starting to flag.
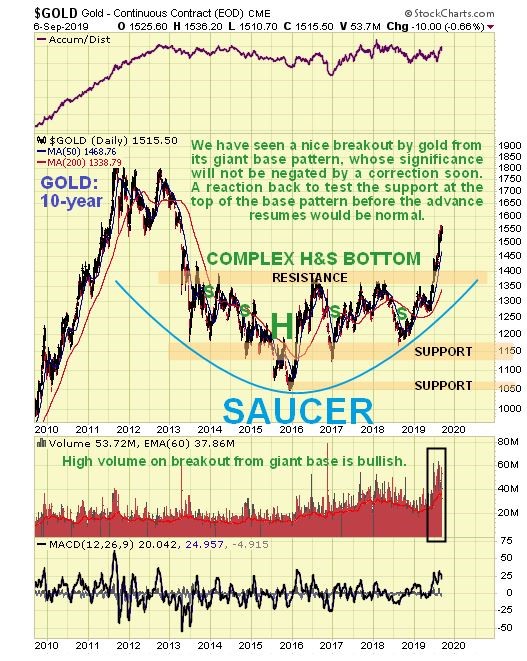
So, how far could gold react back? It happens more often than not that after a price breaks clear out of a giant base pattern, as gold did from its giant complex Head-and-Shoulders bottom or Saucer base shown on our 10-year chart, that it then returns to test support at the upper boundary of the base pattern before turning higher again. That could happen again and it would throw a lot of investors in the sector who are now of the view that we are “off to the races”. So, if it does react back that far don’t be dismayed – on the contrary it would throw up one last great buying opportunity.
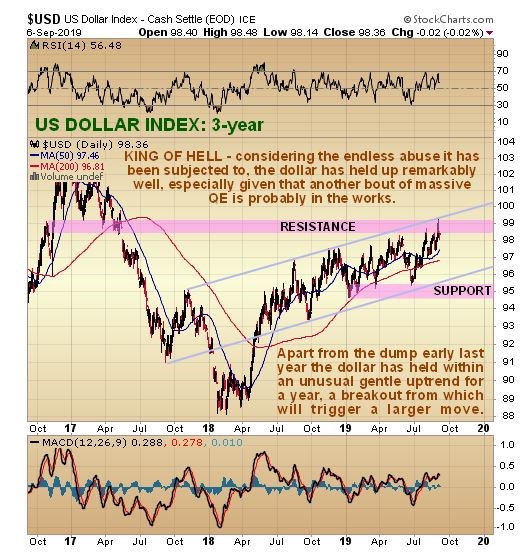
We have had a rather unusual situation in the recent past where the dollar and the Precious Metals have been strengthening together. This is because, in a risk off environment both have been considered safe havens. In a risk on environment this logic works in the other direction so that the dollar and the Precious Metals may both react back together. On the 3-year chart for the dollar index we can see that it is at a good point to turn lower, despite its still bullishly aligned moving averages, as its persistent gentle uptrend has brought it up to the significant resistance level shown.
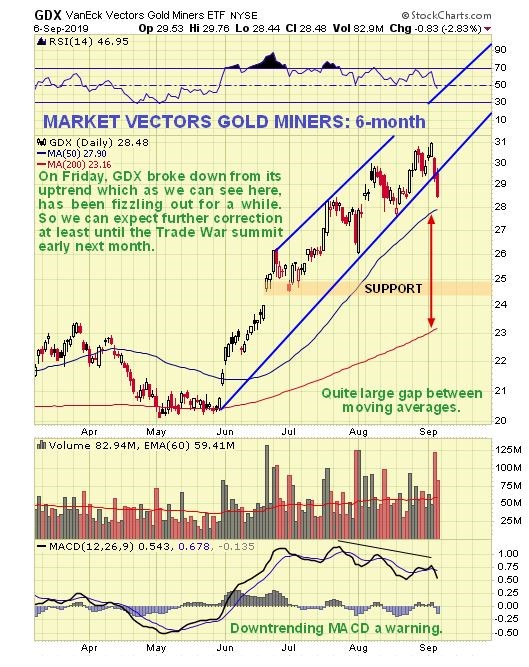
While PM stocks continued to push higher in recent weeks, the decline was losing momentum, as revealed by the downtrending MACD indicator on the 6-month GDX chart below, which led to its starting to break down on high volume on Thursday and Friday. Although it hasn’t yet broken down from the uptrend and below its 50-day moving average, this looks set to happen soon.
So how about COTs and sentiment? – we will now proceed to look at them. We had been wary of calling a top too soon based on the increasingly lopsided COTs, having called a top too soon during the runup early in 2016, but now, given the other factors that we have considered, in particular the negative developments last week, the latest gold COT, which shows high Large Spec long positions and heavy Commercial short positions, certainly makes a reaction back by gold now or soon a lot more likely…
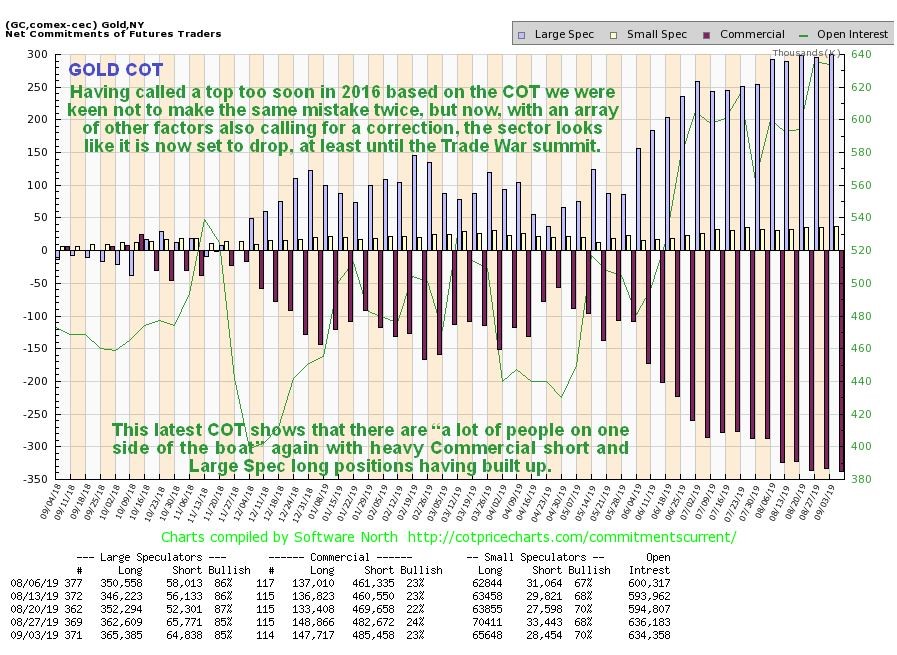
Click on chart to popup a larger, clearer version.
The COT is backed up by the latest Hedgers chart, which goes back to 2010, which shows that positions match the extreme reached in the Summer of 2016, which as we know was followed by a brutal correction for the rest of the year. While a correction certainly looks likely it shouldn’t be so deep, because there is a big difference this time round, which is that gold has broken out into a major new bullmarket – it was still in a basing phase in 2016.
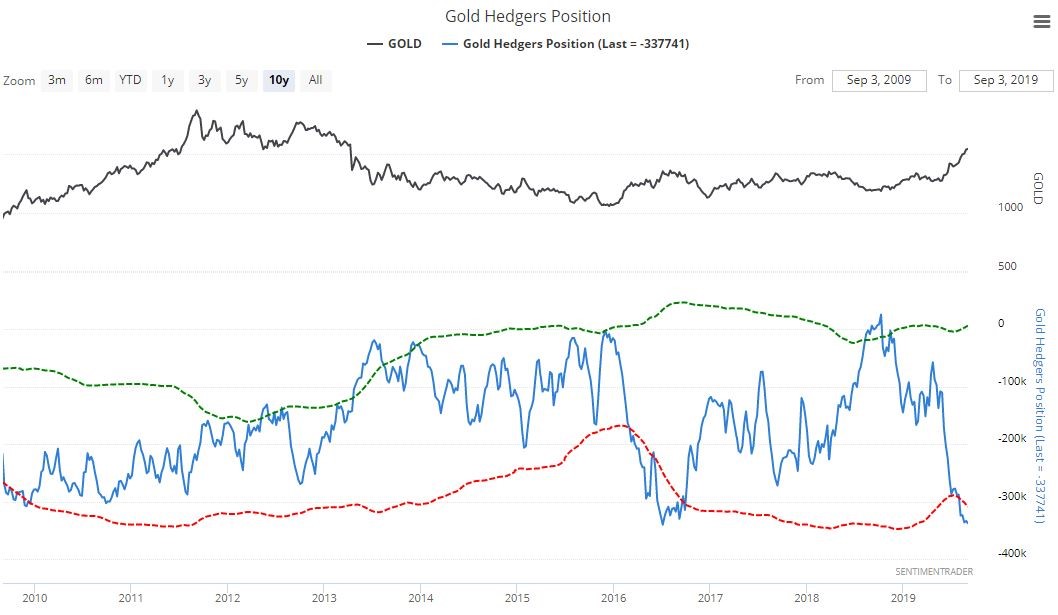
Click on chart to popup a larger, clearer version.
Chart courtesy of sentimentrader.com
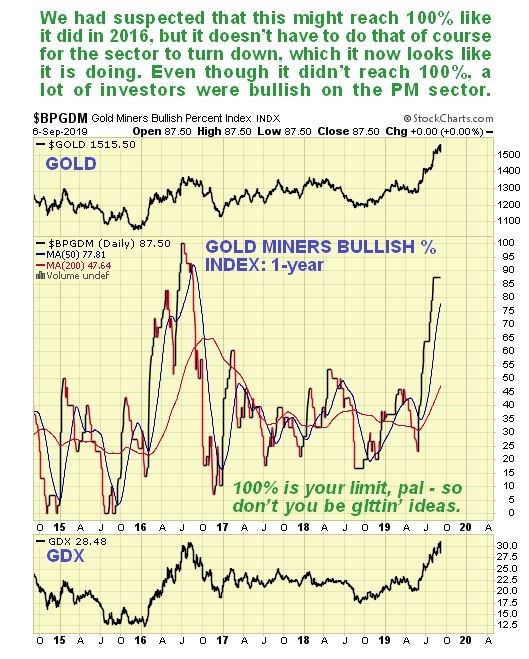
Lastly, the Gold Miners Bullish % Index is still at 87%, and while we waiting to see if it would hit 100% as it did in 2016, it doesn’t have to of course before a reversal occurs, and 87% certainly shows that enough people are bullish to warrant a trip to the fleecing shed.
Investors in the Precious Metals sector should therefore take measures to protect themselves, which include stepping aside for a while, or if staying long, hedging with inverse ETFs such as DUST, or options (options are much more cost effective), GLD being very suitable are they are highly liquid with narrow spreads, and then we watch for the expected correction to unfold, aware that when it has run its course, we will be presented with a MAJOR BUYING OPPORTUNITY.
********

Clive P. Maund’s interest in markets started when, as an aimless youth searching for direction in his mid-20’s, he inherited some money. Unfortunately it was not enough to live a utopian lifestyle as a playboy or retire very young. Therefore on the advice of his brother, he bought a load of British Petroleum stock, which promptly went up 20% in the space of a few weeks. Clive sold them at the top…which really fired his imagination. The prospect of being able to buy securities and sell them later at a higher price, and make money for doing little or no work was most attractive – and so the quest began, especially as he had been further stoked up by watching from the sidelines with a mixture of fascination and envy as fortunes were made in the roaring gold and silver bull market of the late 70’s.
Clive furthered his education in Technical Analysis or charting by ordering various good books from the US and by applying what he learned at work on an everyday basis. He also obtained the UK Society of Technical Analysts’ Diploma.
The years following 2005 saw the boom phase of the Gold and Silver bull market, until they peaked in late 2011. While there is ongoing debate about whether that was the final high, it is not believed to be because of the continuing global debasement of fiat currency. The bear market since 2011 is viewed as being very similar to the 2-year reaction in the mid-70’s, which was preceded by a powerful advance and was followed by a gigantic parabolic price ramp. Moreover, Precious Metals should come back into their own when the various asset bubbles elsewhere burst, which looks set to happen anytime soon.
Visit Clive at his website: CliveMaund.com


