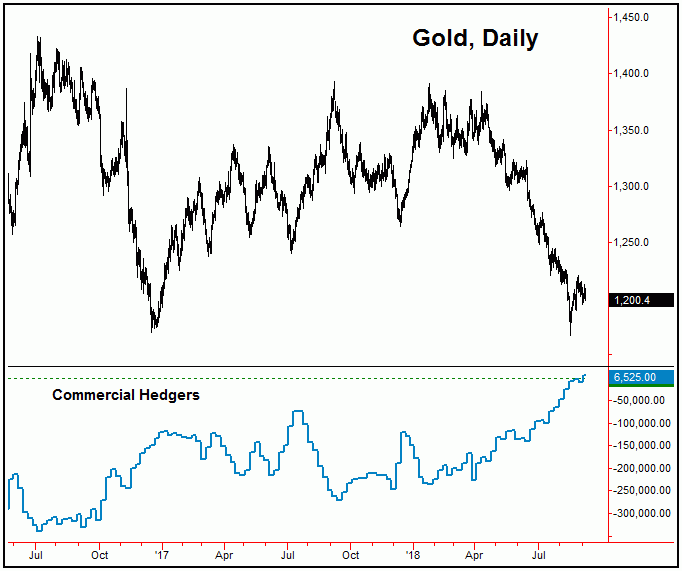
Hedgers Move To Net Long Position


Last week’s action saw gold holding in a consolidation pattern, with the metal bottoming in Tuesday's session with the tag of 1195.10 - before rallying up to a Thursday high of 1212.70, then pulling back off the same to end the week.
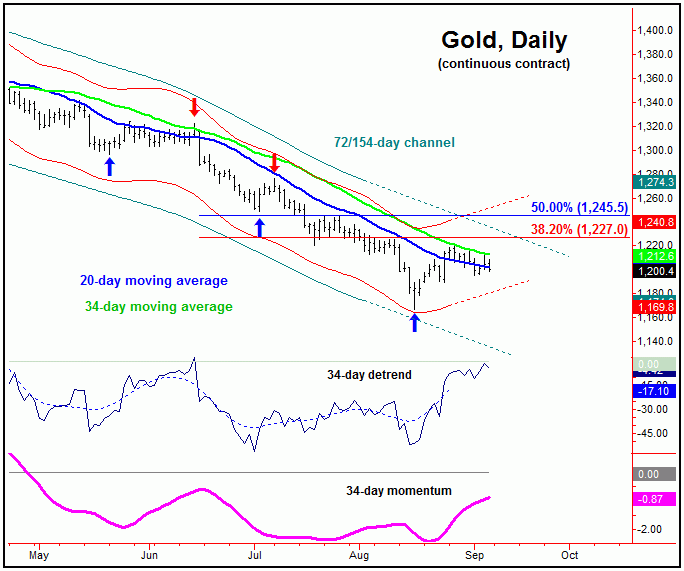
Gold's Cyclical Picture
For the short-term, the most recent rally phase was well overdue for the gold market, with the same coming as a result of the smaller-degree 10, 20 and 34-day time cycles. In terms of price, each of the 10, 20 and 34-day moving averages were hit with this rally, thus satisfying my normal assumption - which means that a cycle will revert back to a moving average of the same length better than 85% of the time.
Having said the above, until proven otherwise, the mid-term cycles (chart, above) are still seen as heading south at the present time, and could only turn up with a daily close above the 1263.50 figure (December, 2018 contract). With that, the overall assumption is that the most recent short-term rally will end up as a countertrend affair (Elliott wave 4), and with that will be followed by a test or a break below the 1167 bottom on the next swing to the downside.
Stepping back, should a drop back to or below the recent lows be seen on the next move lower, then it would be viewed as a strong buy signal for gold. That would be due to the completion of a five wave move to the downside, and would also be due to the position of the commercial hedgers - which have now moved to a net long position in the metal:
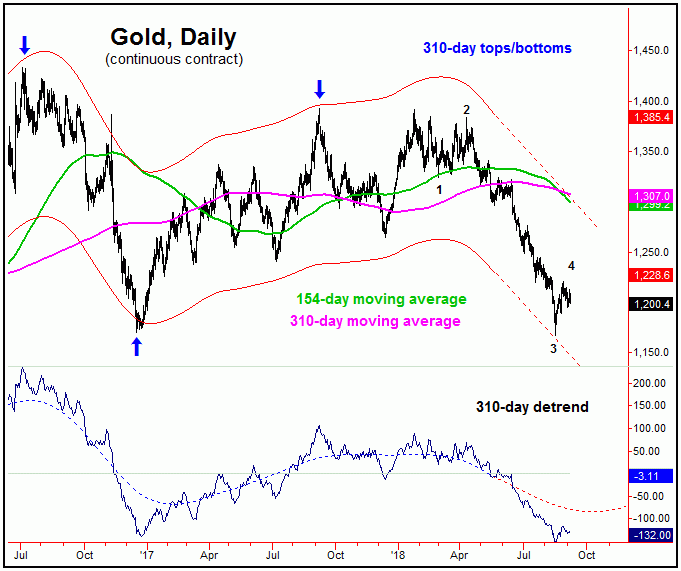
For the bigger picture, if and when the next mid-term trough is set in place, the probabilities will favor a rally which takes the metal back to or above the 154 and 310-day moving averages, though a move now assumed to end up as countertrend - against the September, 2017 peak of 1392. From there, lower lows should play out on the next downward phase of the 154 and 310-day cycles.
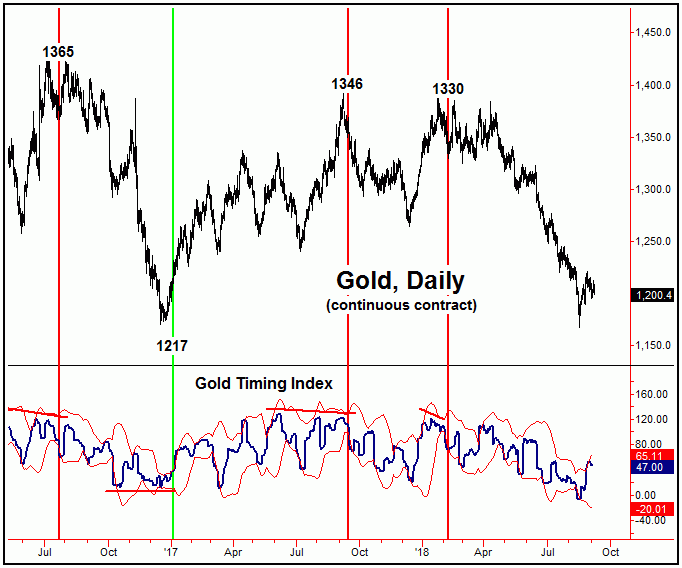
As for our Gold Timing Index, with the close above its upper standard-deviation band on 8/27/18 (i.e., 1216), this indicator is currently on a short-term sell signal - but with the same still looking for a mid-term buy signal at some point going forward. For the latter to materialize, price would need to register a lower low - with the indicator itself forming a 'higher-low'. From there, the actual trigger would be a daily close above the indicator's upper standard-deviation band. We'll see how this plays out in the days/weeks ahead.
Jim Curry
The Gold Wave Trader
http://goldwavetrader.com
http://cyclewave.homestead.com
Jim Curry is the editor and publisher of The Gold Wave Trader and Market Turns advisories - each of which specializes in the use of cyclic and statistical analysis to time the Gold and U.S. stock markets. He is also the author of several trading-related e-books, and can be reached at the URL's above.


