How Commodities Will Perform In The Impending Massive Credit Crunch


An enormous “sword of Damocles” hangs over all markets now. A massive liquidity drain is underway as global QE reverses into QT and rates rise against the background of immense ubiquitous crippling debt burdens. What this means is that the biggest credit crunch of all time is bearing down on us, which will involve markets crashing in the absence of bids, serious dislocation of capital markets and out of control interest rates.
This is probably the high point for Trump’s Presidency as the stockmarket enjoys its final “swansong rally” ahead of the crash, buoyed up the last of the stock buybacks before rising rates choke them off, and the dumbest of the dumb money who think that because the market has been in an uptrend for years it’s going to continue.
The Fed has been playing a stealth game for a long time now, gradually but steadily raising rates and hoping that the market won’t notice, and also furtively offloading its Treasury hoard, and other Central Banks are following the Fed’s lead and doing likewise. The liquidity that drove the massive bubbles in Real Estate and stockmarkets is being pulled. That must inevitably lead to these markets dropping, and we are already seeing the start of it with the Emerging Markets plunging and hitherto red hot Real Estate markets cooling. When punters realize that the game is over, the decline is likely to become disorderly and involve a number of crash phases.
The Fed is always behind the curve and reactive. It has been undermining the markets for over a year now with its raising of interest rates and now QT, so when the markets buckle and cave in, it won’t be “something out of the blue” or an “Act of God” as the mainstream media will inevitably portray it, it is eminently predictable, and slated to happen soon. The reason that the Fed and other Central Banks are raising rates and withdrawing liquidity is that they know there is another mammoth crisis looming, and they are scrambling to buffer themselves ahead of it, by giving themselves “wiggle room” to lower rates, and scaling back their massive holdings of Treasury paper etc. The trouble is that it’s a very delicate balancing act, and they are inevitably overplaying their hand to the extent that their actions will bring about the crisis that they are seeking to avoid, or at least get ahead of.
When you get up in the morning, you know that no matter how bright and strong the sun is around midday, night must later follow. In the same way bullmarkets are followed by bearmarkets, with the consolidation and contraction in the bearmarket phase of the market cycle being necessary to strip out excess and waste and cull the weak and inefficient. What has happened in recent years is that Central Banks and governments have intervened with their liquidity injections to artificially extend the bullmarket – a bearmarket should have started several years back – it is like a guy who has just finished a marathon being pumped with drugs and told to run another 10 miles. What this means is that when the bearmarket eventually does hit it arrives like a category 5 hurricane, which is actually what is called for now given the monstrous debt bubbles that have been inflated to gigantic proportions by all this relentless money pumping. Since what they have done in recent years amounts to pure lunacy according to normal criteria, we must ask ourselves “Why did they do it?” – the answer is twofold. The voting masses are economically infantile and reward politicians who give them what they want – what they want is endless prosperity and they will vote out any politician who threatens to inflict austerity on them, even if it’s for their own good. Secondly, the ZIRP policies of recent years have allowed for a massive transfer of wealth from the masses, the middle and lower classes, to the elites and super wealthy. The way it works is this – while the little folk continue to pay usurious interest rates to borrow money, the 1% pay almost nothing, borrow wads of cash and turn round and speculate in Real Estate, stockmarkets and other things like collectibles, driving huge bubbles in these markets, and then ideally cash out before the crash.
Now, you might say, when the Fed and other Central Banks realize that they have pulled the plug on the markets with their liquidity drain, won’t they simply reverse course to stabilize the markets and pump them up again. Yes, of course they will, but by then it will be too late, as a self-feeding liquidation cycle will be going full bore, and any changes they make will need time to take effect. However, what will happen soon after they reverse course is that the dollar will suddenly find it has no wind in its sails, and gold and silver will skyrocket at the prospect of an unprecedented new round of QE that will have to be of staggering proportions to stabilize the ship, and will set us on the course to hyperinflation. This will be the point at which hapless citizens start to realize that what happens in Venezuela doesn’t necessarily stay in Venezuela.
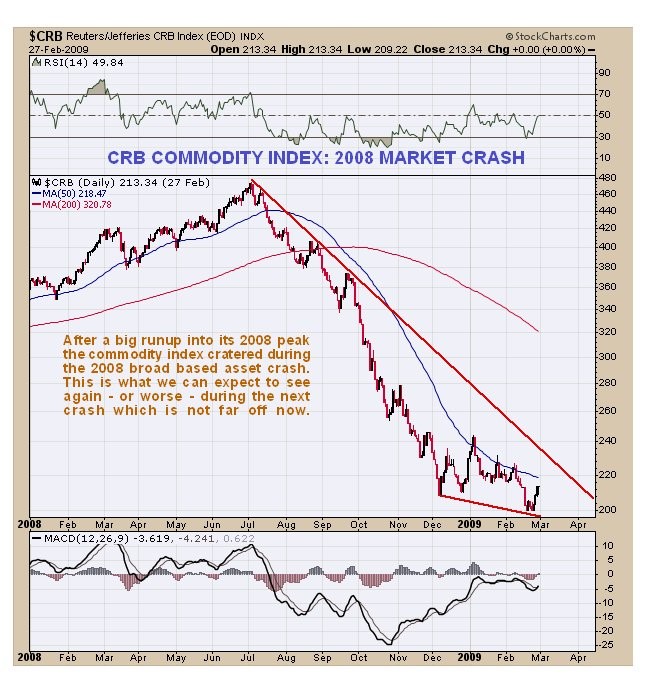
With a monstrous liquidity crunch bearing down on us, you don’t have to be a genius to work out what will happen to commodities. Look at 2008 as a dry run for what’s coming. Basically anything that can be sold for cash will be, and that will include commodities. It will only be when the Central Banks and governments reverse course into mega QE that commodities will quickly reverse and soar, especially the Precious Metals. Now we will look at some commodity charts to see how things are shaping up and to figure out what to expect. First though, we will go back to school with a review of what happened to commodities in 2008, as our example of what to expect, knowing that this time it should be worse.
We’ll start with the general CRB commodity index, which has a big oil component, where we see on the chart for the 2008 crash that it got more than cut in half during 2008 and going into 2009. Not a great performance and the clearest of indications about what we can expect to see when the building liquidity crisis hits.
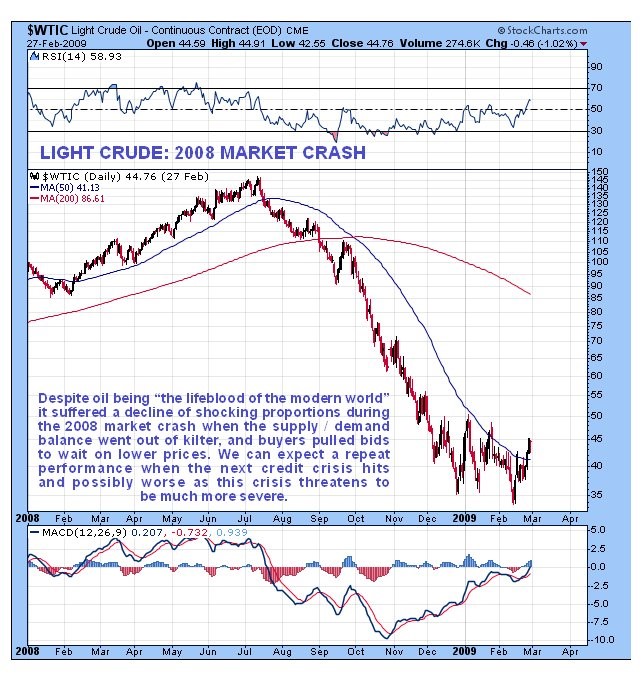
As for oil itself its decline during the 2008 crash was of a truly shocking magnitude, even with the benefit of 10 years’ hindsight – after all, oil is supposed to be the “lifeblood” of the modern world, is it not?
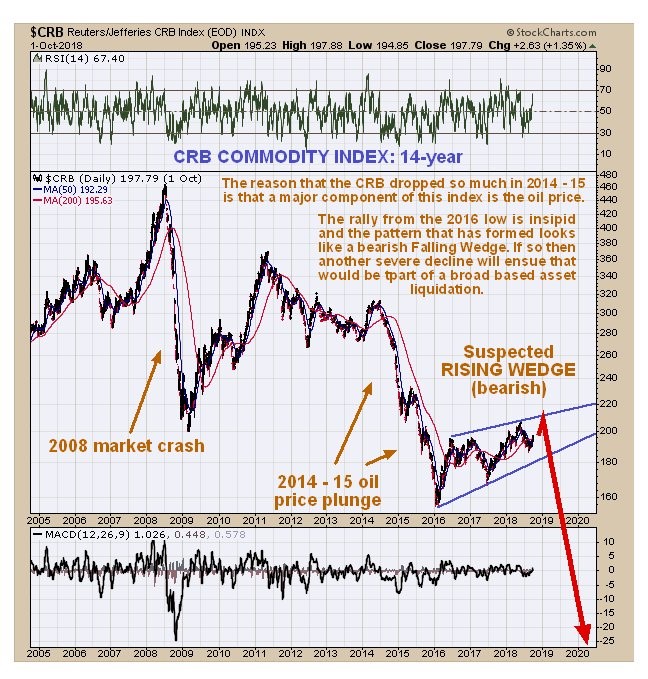
How does the drop in commodities back then relate to what has happened since and up to now? To see that we now look at a 14-year chart for the CRB index. After the 2008 – 2009 crash, the index recovered when the ship was stabilized after the crash by money pumping and bounced back, but then look what happened – in marked contrast to many other assets like Real Estate and stocks, commodities went into a severe bearmarket starting in 2011 and have never really recovered. Why is that? – the reason is that while successive QE programs created a lot of cash for the 1% to go on speculative binges, they did little for the real economy, which has largely languished, hence the flaccid demand for commodities. This is why real unemployment in the US, as distinct from false government data, is something near 20%. For the true data on things like this go to John Williams’ Shadowstats.com. It is widely thought that commodities hit a final low early in 2016 but on this chart the subsequent recovery looks weak and insipid compared to the plunge that preceded it. What it looks like in fact is a bearish Rising Wedge, and if this is what it is then a breakdown into another dramatic plunge lies ahead of us, which of course fits with our forecast for a severe credit crunch.
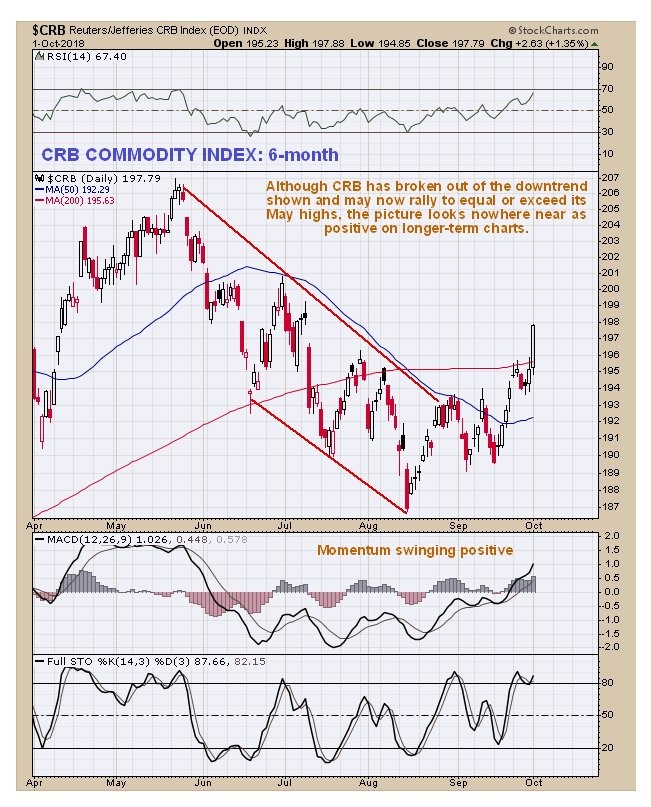
Thus, we should not be taken in by the CRB breaking out into a new intermediate uptrend yesterday, as shown on its 6-month chart, even if it equals or exceeds its highs of last May.
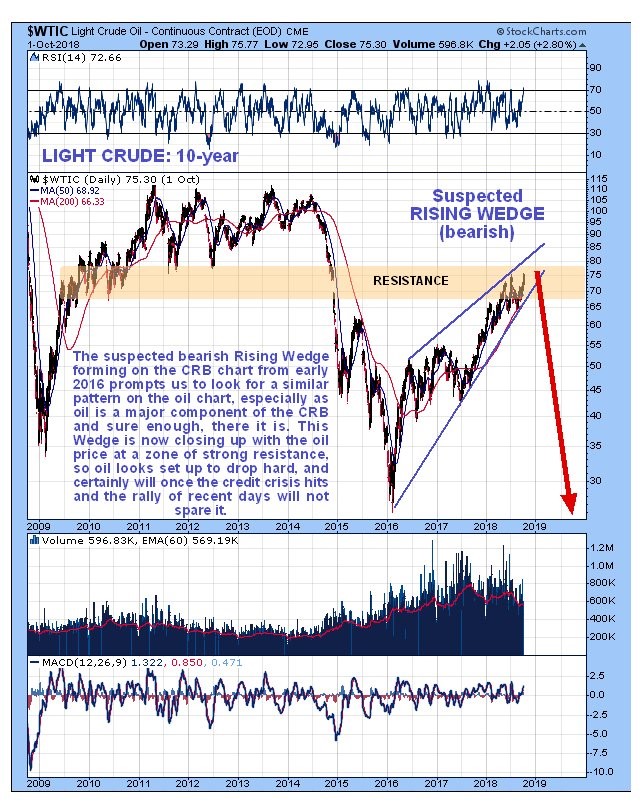
We have mentioned that oil is a big component of the CRB and if the CRB index looks as it does, then how does the oil chart look? It too should be marking out a potentially bearish pattern should it not? – it is. If we look at the latest 10-year chart for light crude we see that it is approaching the apex of a bearish Rising Wedge that is rapidly closing up and is also in a zone of strong resistance. Together these factors suggest that it will break down from the Wedge before much longer and plunge, which again accords with our forecast for a severe credit crunch, and since this credit crunch looks set to be far worse than the one in 2008, we could easily see oil drop below its early 2016 lows in the $20’s, barring a major military conflict in the Mid-East of course.
The challenge for us is to make our forecasts for individual stocks, and for the Precious Metals sector, consistent with what is set out here. For example, we know that COTs and Hedgers’ positions for silver are already very bullish by normal standards, but that won’t stop it dropping further during a broad based asset liquidation. Similarly, individual stocks in other sectors recommended on the site on their own individual merits could make sizeable gains ahead of the market crash, but once it hits could get caught up in the maelstrom – it’s all a question of timing.
Finally, whilst we can’t be sure exactly when the stockmarket will turn tail and head south, we know that a savage bearmarket is drawing closer and we end with a look at a couple of many charts / indicators showing the market’s condition is extreme…
********

Clive P. Maund’s interest in markets started when, as an aimless youth searching for direction in his mid-20’s, he inherited some money. Unfortunately it was not enough to live a utopian lifestyle as a playboy or retire very young. Therefore on the advice of his brother, he bought a load of British Petroleum stock, which promptly went up 20% in the space of a few weeks. Clive sold them at the top…which really fired his imagination. The prospect of being able to buy securities and sell them later at a higher price, and make money for doing little or no work was most attractive – and so the quest began, especially as he had been further stoked up by watching from the sidelines with a mixture of fascination and envy as fortunes were made in the roaring gold and silver bull market of the late 70’s.
Clive furthered his education in Technical Analysis or charting by ordering various good books from the US and by applying what he learned at work on an everyday basis. He also obtained the UK Society of Technical Analysts’ Diploma.
The years following 2005 saw the boom phase of the Gold and Silver bull market, until they peaked in late 2011. While there is ongoing debate about whether that was the final high, it is not believed to be because of the continuing global debasement of fiat currency. The bear market since 2011 is viewed as being very similar to the 2-year reaction in the mid-70’s, which was preceded by a powerful advance and was followed by a gigantic parabolic price ramp. Moreover, Precious Metals should come back into their own when the various asset bubbles elsewhere burst, which looks set to happen anytime soon.
Visit Clive at his website: CliveMaund.com


