An Important Gold Chart Every Investor In The West Needs To See


The Western powers are in serious trouble. The once great British Anglo-American Empire, the envy of the world, now resembles more of a phony Hollywood Set backed by a mountain of worthless derivatives and debt. The only thing holding up the Western Financial Empire’s House of Cards is faith that market will continue to believe increasing debt and monetary printing are practical solutions for long-term prosperity.
I imagine there is a limit to the level of INSANITY these markets can reach. Here is one chart that perfectly describes how this insanity has impacted investors in the top Western countries:
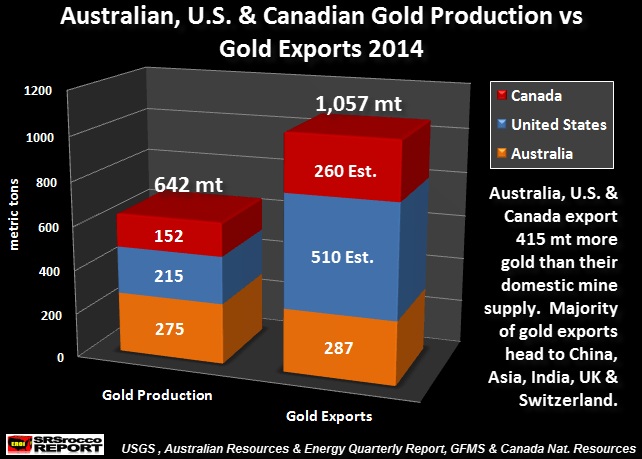
According to the data put out by the official sources from Australia, Canada and the United States, these three countries had combined gold production of 642 metric tons (mt) in 2014. Australia was the number one producer at 275 mt (Australia Resources & Energy Quarterly Report – March 2014), the United States came in second (USGS estimate), and Canada placed last at 152 mt (Natural Resources Canada Monthly Production Statistics 2014).
If we look at the bar on the right side of the chart, these three countries exported an estimated 1,057 mt of gold, or 415 mt more than they produced. This is an amazing amount of gold exports when we consider China and Russia hold onto the majority of their domestic gold production.
The data for Australia’s total gold exports of 287 mt in 2014 comes from the Australian Resources & Energy Quarterly Report, but the figures for the United States and Canada were my estimates based on data I received from the USGS and GFMS 2014 Gold Survey.
The Western Powers have been so successful at brainwashing their citizens into believing PAPER ASSETS are wealth, GOLD the HIGHEST QUALITY store of value, is exported overseas. Makes perfect sense… aye?
The chart above doesn’t include gold imports into these three countries. I estimate that total gold imports into Australia, Canada and the United States will be in the neighborhood of 585 mt in 2014. This would give us a surplus of 170 mt of gold (642 mt supply + 585 mt imports = 1,227 mt total – 1,057 exports = 170 mt).
The World Gold Council stated that total U.S. Gold consumption in 2014 was 179 mt (132 mt of jewelry and 47 mt of physical investment). So, here we can see that the United States consumed more than the total 170 mt gold surplus from these three countries.
Yes, I realize this doesn’t include gold recycling into the equation, but it is quite alarming to see the top three Western gold producers exporting more gold than they produce and 70% of their total gold imports.
When the U.S. Dollar and Treasury Market finally collapse, Western investors will be the last to know just how silly it was to export all that HIGH QUALITY GOLD overseas.
![]()

Independent researcher Steve St. Angelo (SRSrocco) started to invest in precious metals in 2002. Later on in 2008, he began researching areas of the gold and silver market that, curiously, the majority of the precious metal analyst community have left unexplored. These areas include how energy and the falling EROI – Energy Returned On Invested – stand to impact the mining industry, precious metals, paper assets, and the overall economy. He has written scholarly articles in some of the top precious metals and financial websites. Visit his website SRSrocco Report.


