Key Support & Resistance Levels for Financials, S&P500, Silver and Gold


During the past 4 months we have seen the financial sector (banks) under selling pressure. With real estate prices continuing to fall and foreclosures picking up speed again investors have not been that interested in holding bank stocks. And we all know that without the financial sector moving higher we cannot expect the broad market to make any significant moves higher either.
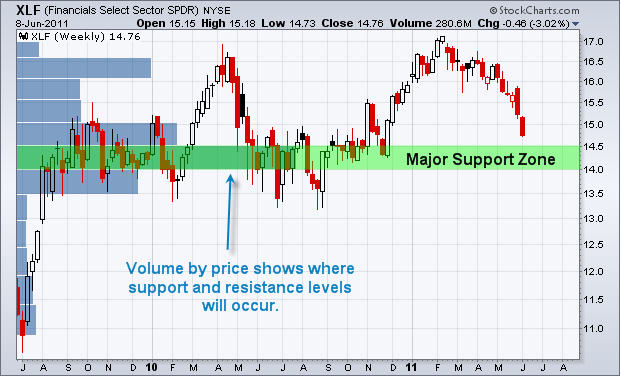
If you take a look at the financial sector ETF XLF you will notice that it's now trading near a major support level (fair value) where most shares changed hands in the past. With this sector sliding 13% from the highs in February and the fact that it's making a parabolic drop into a support zone I can't help but think a bounce is very likely to form soon.
XLF Financial Sector ETF - Daily Chart
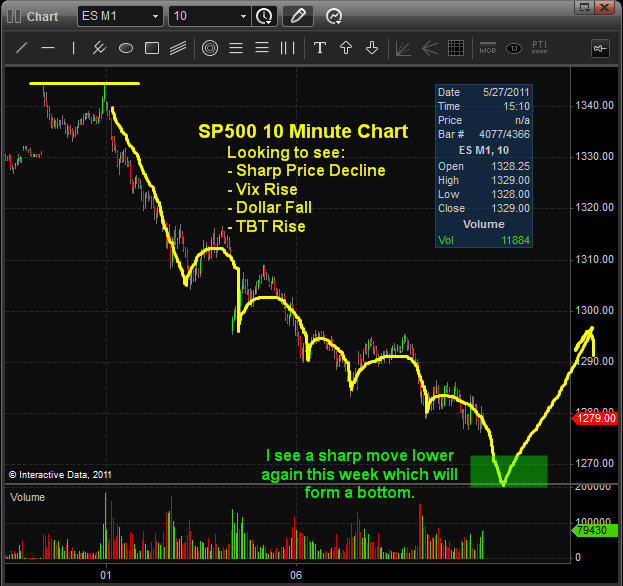
SP500 Futures - 10 Minute Chart
With the financial sector nearing major support and the SP500 staring to show signs of a bottom forming I will admit my heart is starting to pound in excitement for an entry point. I am really hoping that this week we see another sharp drop in the stocks which should spikes the volatility index up (VIX) to 21 or higher. If we can see this take place, then I will be taking a long position to catch a 2-15 days bounce in the broad market.
The chart of the past 10 trading sessions below shows a price and volume pattern which typically leads market bottoms. I'm keeping a close on things these days…
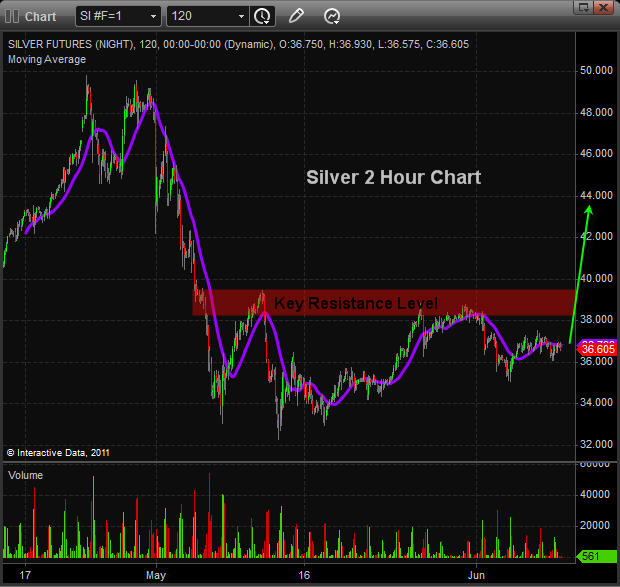
Silver 2 Hour Chart
Silver took a big hair cut last month falling from $50 down to $33 per ounce. Ever since then it has been trying to form a base which will act as the next launch pad for higher prices. So far it is looking good but there is a key resistance level to breakthrough before fireworks. Keep your eye on the silver bullet.
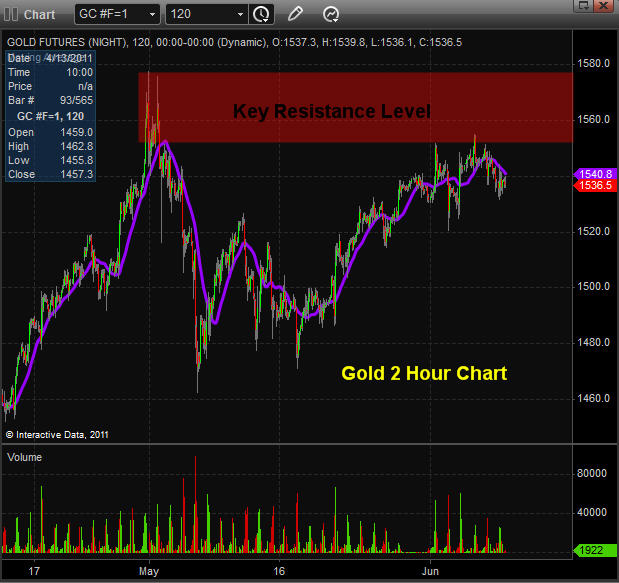
Gold 2 Hour Chart
Gold is back trading up near its high but is starting to struggle with resistance (sellers). We could easily see gold pullback to the $1520 area before taking another run at resistance.
Mid-Week Update Conclusion
In short, I feel investors are getting very nervous because of the 6 week sell off in stocks. There have been some technical support levels broken on the SP500 and other indexes and its these broken levels which have investors running for the door. The thing is, this type of selling happens every year and generally 2 -3 times. During a bull market I like to see fear in the eyes of investors. Until we are proven wrong about buying extreme oversold dips, they continue to be my focus.
Also if the financial sector can find a bottom and start to rally, then we will see higher stock prices across the board in the coming weeks. I am currently neutral on metals, oil and the dollar. But am getting bullish on financials and the SP500 as they move lower.

Chris Vermeulen has been involved in the markets since 1997 and is the founder of Technical Traders Ltd. He is an internationally recognized technical analyst, trader, and is the author of the book: 7 Steps to Win With Logic
Through years of research, trading and helping individual traders around the world. He learned that many traders have great trading ideas, but they lack one thing, they struggle to execute trades in a systematic way for consistent results. Chris helps educate traders with a three-hour video course that can change your trading results for the better.
His mission is to help his clients boost their trading performance while reducing market exposure and portfolio volatility.
He is a regular speaker on HoweStreet.com, and the FinancialSurvivorNetwork radio shows. Chris was also featured on the cover of AmalgaTrader Magazine, and contributes articles to several financial hubs like MoneyShow.com.


