The Storm Clouds Are Gathering
There is a now widespread universally held belief, especially amongst “dumb money” market participants, that the markets cannot drop because the Fed is going to keep creating money in ever greater quantities to throw at pumping them higher and higher. This erroneous belief appears to be based on an assumption that the Fed cares about the economy or the welfare of the citizenry, when the reality is that the reason it exists is as a “wealth transfer engine” whose prime function is to serve as a mechanism for transferring the fruits of the labor of the population at large to the elite cadre at the top of the pyramid, and they even have a pyramid on their Federal Reserve notes. They achieve this through “systemic inflation” which with a fiat money system in place now for many years enables them to print unlimited quantities of money that they gift in the first instance to themselves and their crony associates and large favored corporations, and then let the rest out into the economy, with the tab for all this being pushed onto the hapless citizenry in the form of inflation. This is why the dollar has devalued by about 97% in purchasing power since the Fed came into existence in 1913.
Now, with the fiat system approaching its nemesis as debts and money creation go parabolic, the gloves are off and they don’t even bother to make any pretense about it – they create trillions which they hand straight to big favored corporations and Wall St banks, with the implied challenge to the ordinary citizen being “You don’t like it? – well, what are going to do about it?” They are not just above the law, they ARE the law and they can and will do as they please.
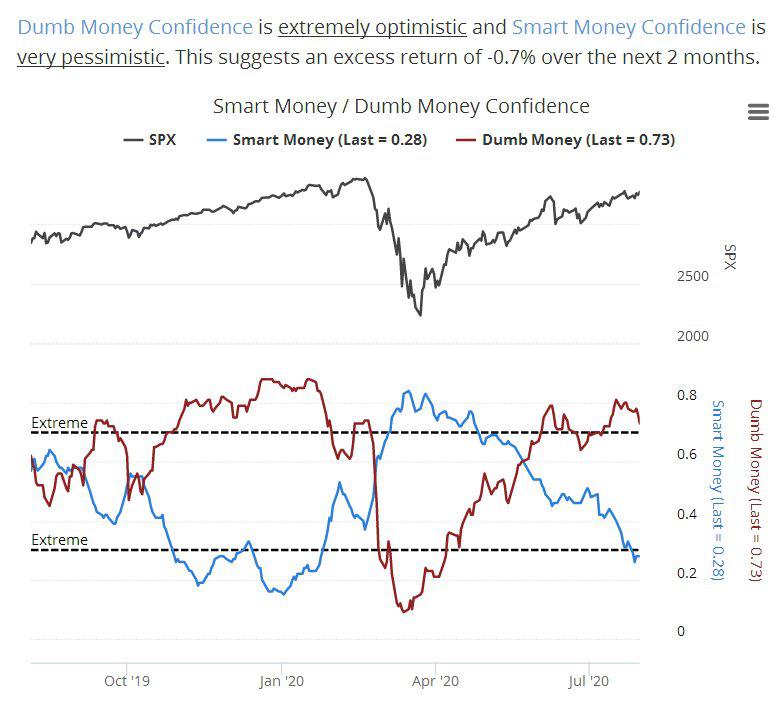
Given that the Fed’s primary objective is to transfer wealth from the masses to the elites, and given that after months of the stock market trending higher, Dumb Money has been piling into the market again as Smart Money exits, as we can see on the latest Smart – Dumb chart below, it would seem irresistibly attractive to them to pretty soon rip the rug out from under the market and send it plunging again, as they did in the Spring, and then move in and pick up Dumb Money’s holdings when they sell in distress at the bottom, and start the whole wash, rinse and repeat cycle again – and if they crash the markets soon they should be able to achieve a long held objective of getting rid of Trump for good measure, since the markets would not recover enough by election time for him to capitalize on it.
Chart courtesy of sentimentrader.com
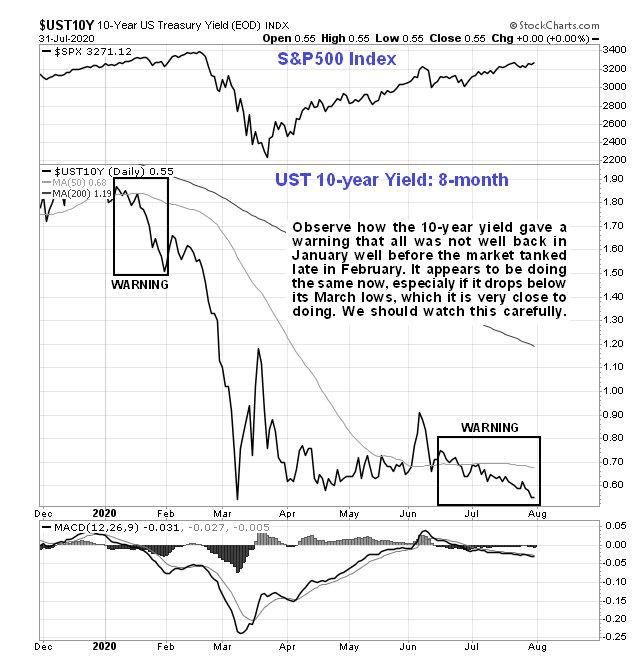
If this is what is setting up, it is incumbent on us to keep an eagle eye out for any warning signs that the markets may be about to about to buckle and plunge again. Fortunately there are a number of things that we can watch that provide early warning of such a development. One important one is the 10-year Yield, whose latest chart is shown below. This provided early warning of the Spring market crash as we can see, and it is clearly an ominous development that it has been crumbling in recent weeks and is already threatening to break below its March lows. If it does, and especially if it should drop more steeply, it will probably trigger another severe market downwave soon after. This is said with an awareness that it can’t actually drop all that much because it is already so low.
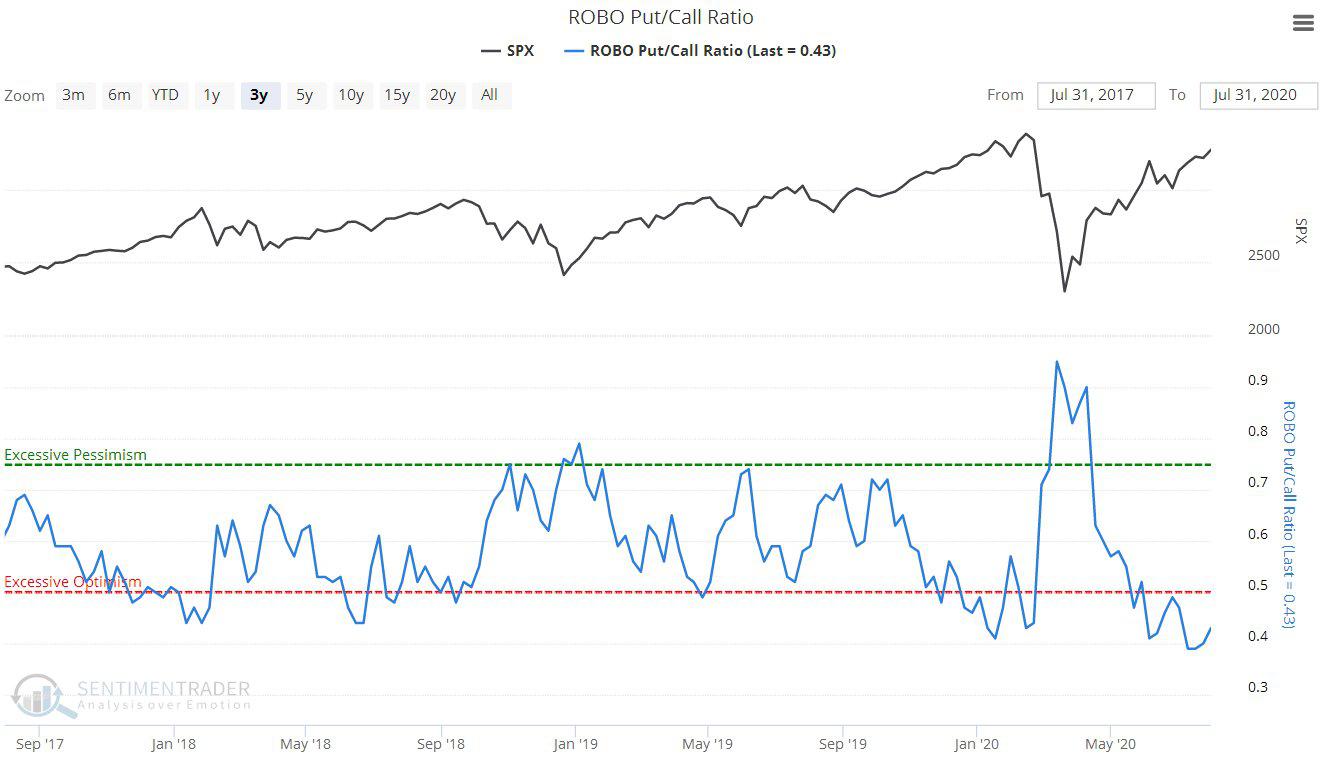
The Put to Call ratio is at a very low level, indicating universal bullishness and complacency, and is at the sort of extreme that we saw last February before the market caved in….
Click on chart to popup a larger, clearer version.
Chart courtesy of sentimentrader.com
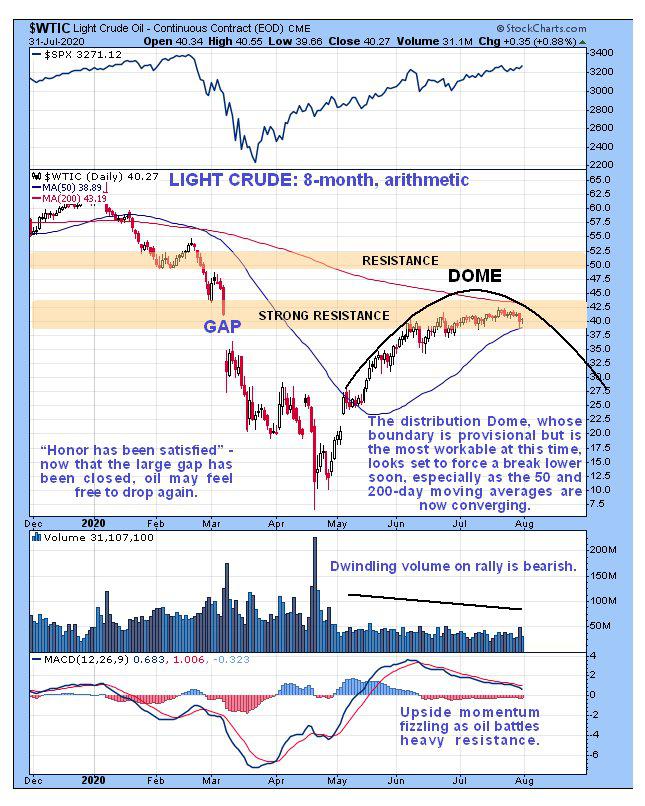
Next, keep a close eye on oil. On our Light Crude chart we can see that it is rounding over beneath heavy resistance having closed a big gap, and ominously the 50-day moving average is drawing close to the still falling 200-day so that these averages are still in bearish alignment with the potential for a big drop – and it isn’t hard to see why it could suffer a big drop, despite all the recent market manipulation that has massaged it higher and higher, because the plain fact of the matter is that if they want to close down economies around the world in pursuit of their dream of crushing the masses, then there is going to be an awful lot more oil sloshing around than there is demand for. The Bollinger Bands that are shown on a version of the year-to-date chart for Light Crude in the latest Oil Market update are pinching in tightly, suggesting that a big move is now imminent.
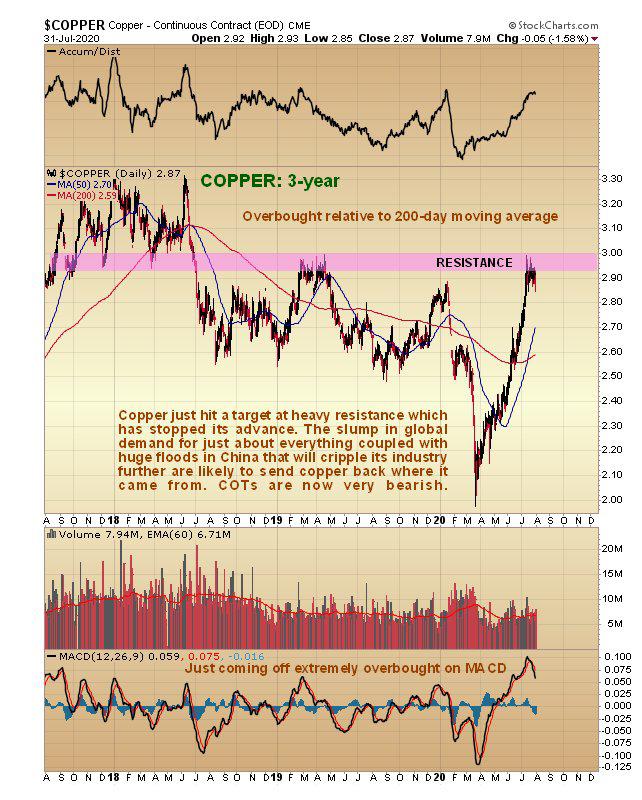
Next copper, whose big recovery rally from the March low to the present appears to have been driven both by a misplaced belief that demand will recover, and an even bigger misconception that demand will recover in China, which is going to be more difficult now that a large part of the heartland of the country is underwater, with the possibility of the 3 Gorges Dam being breached for good measure. As we can see on copper’s latest 3-year chart, it has stalled out at a zone of strong resistance, which it arrived at in an overbought state.
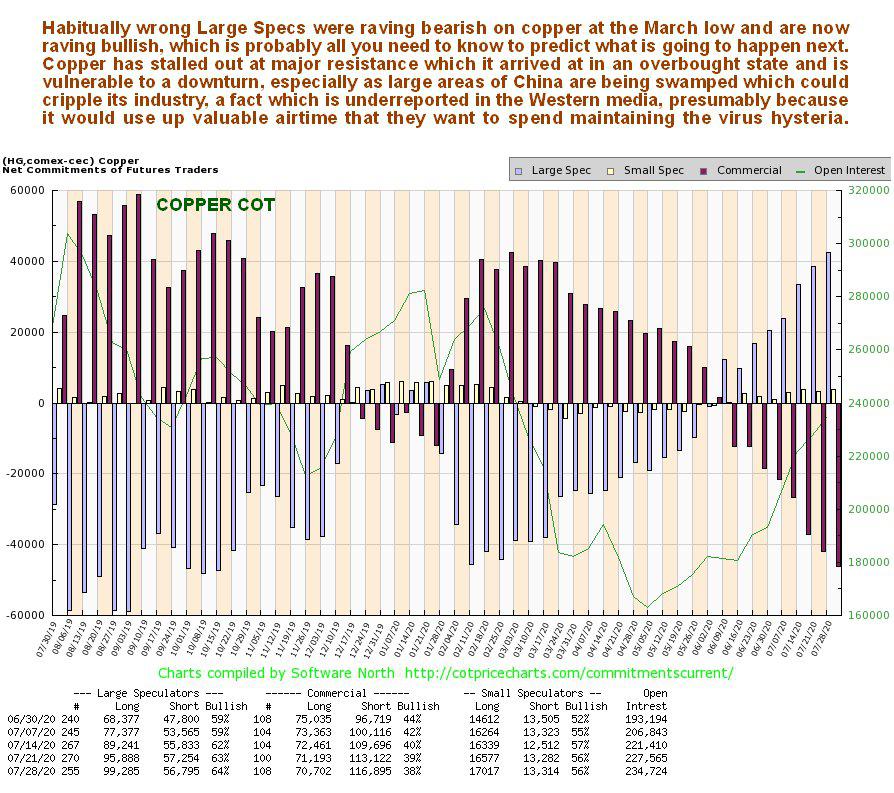
Greatly increasing the chances of copper reversing and going into retreat very soon is its COT structure. On its latest COT chart we see that Dumb Money – the Large Specs – are now heavily long the metal after being heavily short at the March low. This COT chart looks very bearish and it is known that copper is a lead indicator for the markets, hence its nickname, Dr Copper. So this is another clear warning sign.
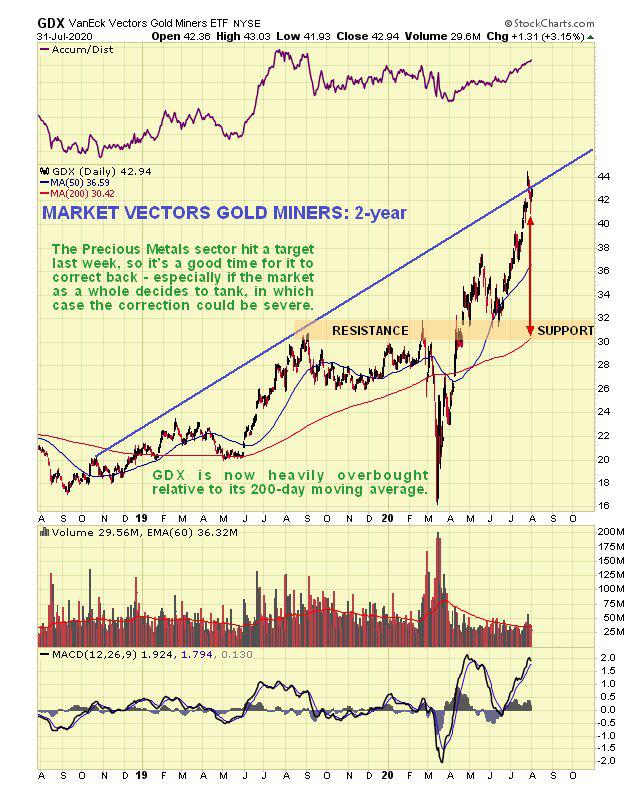
Finally, GDX hit a trendline target in a very overbought state last week, with sentiment towards the PM sector at positive extremes. While we could not be more bullish on gold and especially silver for the longer-term, that does not mean that they can’t get dragged down temporarily in a correction by a crashing stock market. That’s why we are pulling in stops and doing GDX Puts as insurance.
This is quite a battery of indications calling for a major market downturn soon, I’m sure you will agree. Could the Fed override it all and keep the markets heading ever skywards by pumping more and more? – maybe – but as I’ve pointed out here they may not want to, since their Prime Directive, which is to transfer wealth from the lower classes to the upper classes or to those who control society should make it irresistible to them to crash the markets here to crush the little guy and provide yet another opportunity to mop up his holdings on the cheap, and probably seal Trump’s fate into the bargain.
*********


