Technical Analysis Of The Markets


Current Position of the Market
SPX: Long-term trend – The bull market is continuing with a top expected in the low 3000s.
Intermediate trend – Another correction has started which could conceivably continue into mid-October.
Analysis of the short-term trend is done on a daily basis with the help of hourly charts. It is an important adjunct to the analysis of daily and weekly charts which discusses the course of longer market trends.
Bulls Prevail – For Now!
Market Overview
After reaching a new all-time high of 2916 on 8/29, SPX started to correct until it came to a good support level which was further buttressed by an important short-term trend line (from 2700). The decline merely skimmed the surface of support before reversing -- a sign of continuing strength. By the end of the week, prices had recovered to 2906 where they appear to be stalling.
The plausible forecast issued last week called for a correction starting at 2916 in the form of an a-b-c pattern which could last into mid-October. To date, there is nothing to confirm or nullify this forecast although, so far, the pattern is evolving as anticipated. Next week will decide if we reached the top of the b-wave on Friday and are about to start wave-c.
The reasons for this correction remain the same: weak seasonal factors compounded by tariffs uncertainties.
As we will see when we analyze the charts, indicators appear to support the fact that last week’s rally was weak and not likely to extend to new highs before some additional correction. This is reinforced by the tepid performance of NDX and IWM.
Chart Analysis (The charts that are shown below are courtesy of QCharts)
SPX Daily Chart
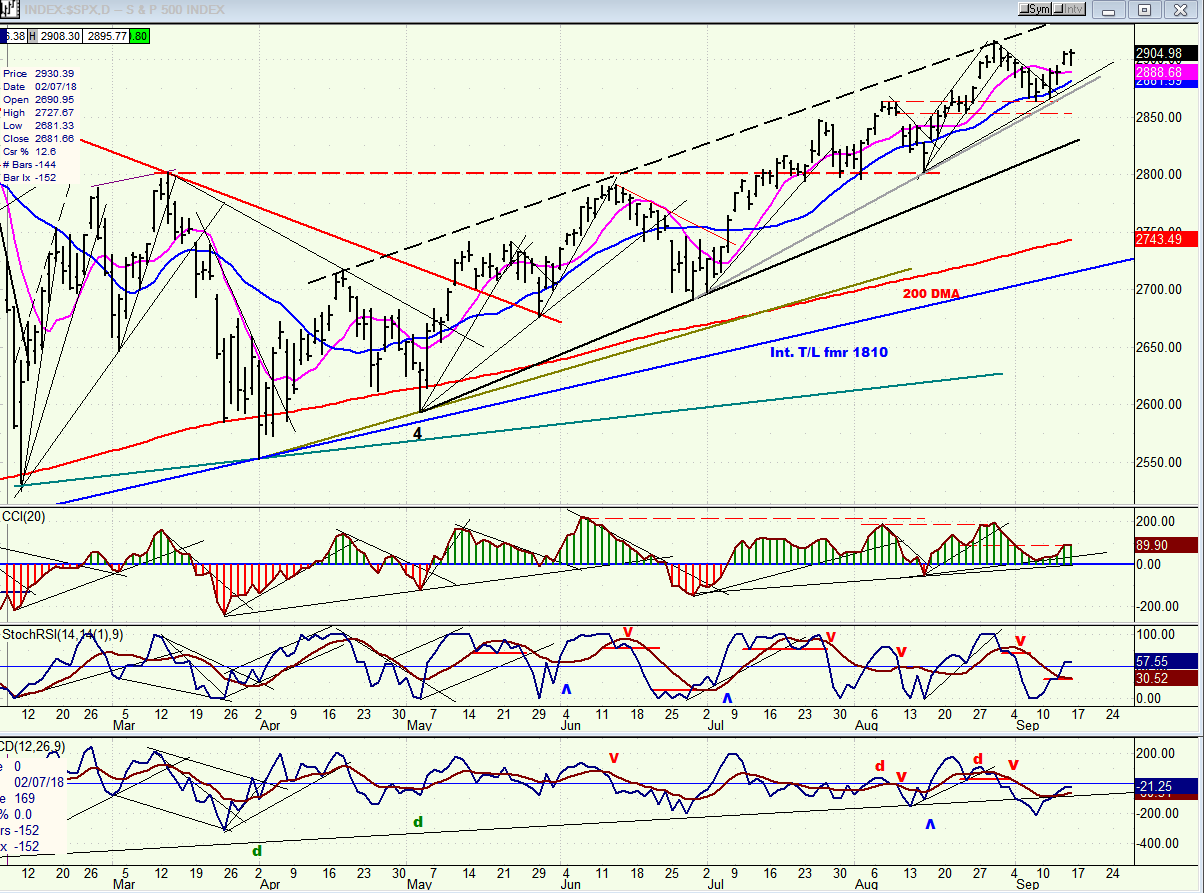
The support area which stopped the decline is identified by two parallel dashed red lines. As noted earlier, prices barely touched the top of this level before rebounding. It also stopped shy of the trend line from 2700. Although it is still considered to be a short-term trend line, it is still of significant length. The market action has made it even more important, because we would now have three touch-points, and if the decline were broken, it would (supposedly) be even more meaningful. Although, I suspect that, in this case, if prices did break through it, they would find support on the next rising trend line below.
We can see that the rally stalled on Friday. Even though the index did make a slightly new high for the day, its range also extended slightly below Thursday’s low. This was due to a statement by Trump regarding tariffs. Hesitation was also somewhat due to this being Friday, and who knows what comment might come from this unpredictable administration over the week-end!
The oscillators also reflect uncertainty. Although the top one (CCI) remains positive, it ended the day well below its recent high. The other two were essentially neutral. That, and the price action, suggests that the momentum of the recovery rally came to a stop on Friday. We will have to wait until Monday to see if it resumes on the upside, or rolls over.
SPX Hourly Chart
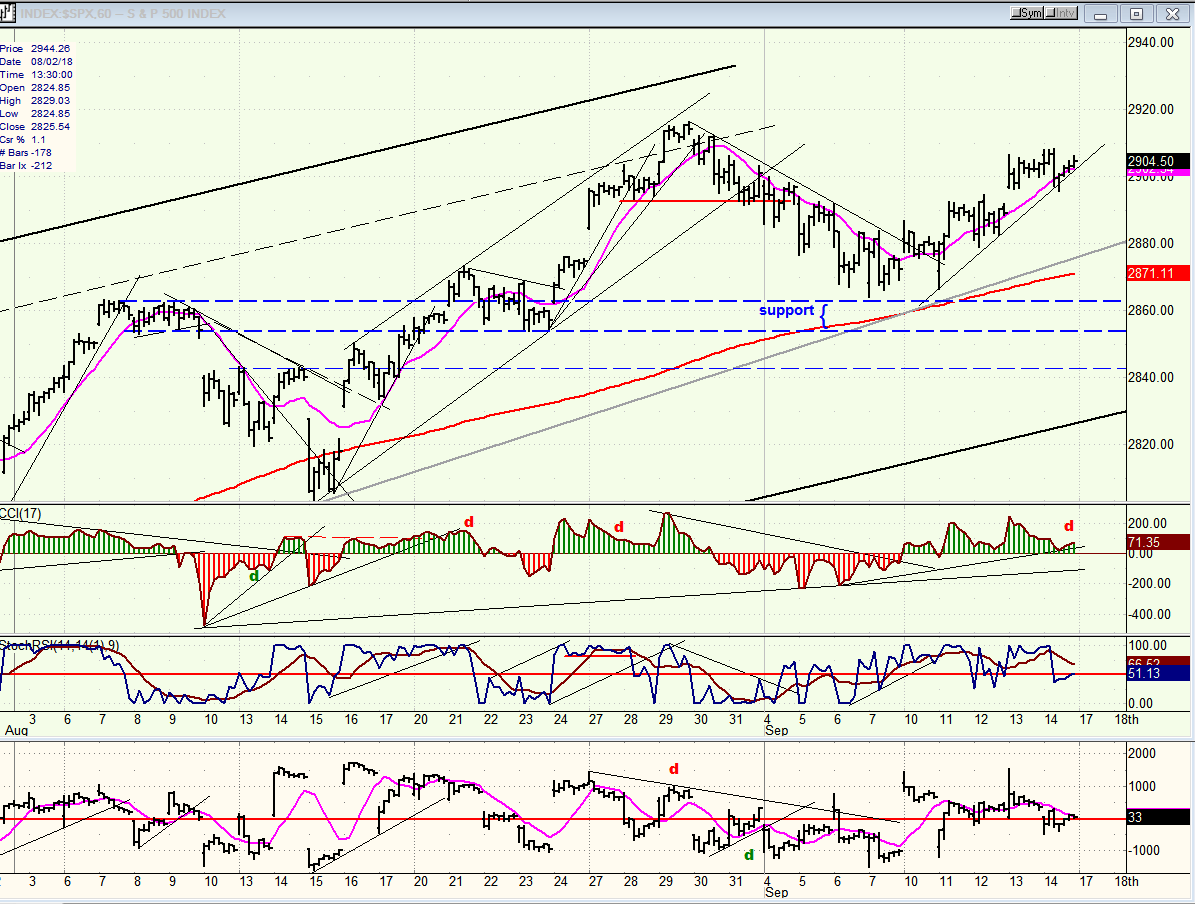
The rally which started from the top of the support level five days ago looks like an upside down replica of the decline which preceded it: simply a staircase pattern of higher highs and higher lows. Just as the downtrend did not reflect much weakness, it does not reflect much strength. Each move has been characterized by a two or three-hour bounce at the opening of trading, followed by a sideways move for the rest of the day. Friday’s high came within 10 points of the former top, but this may be all we get before reversing again.
At the end of Friday, the hourly oscillators were similar to the daily ones, with CCI (top) slightly positive while the other two remained neutral. With September/October typically showing seasonal weakness, the odds appear to favor three or four more weeks of decline ahead.
SPX, NDX, DJIA,IWM (daily)
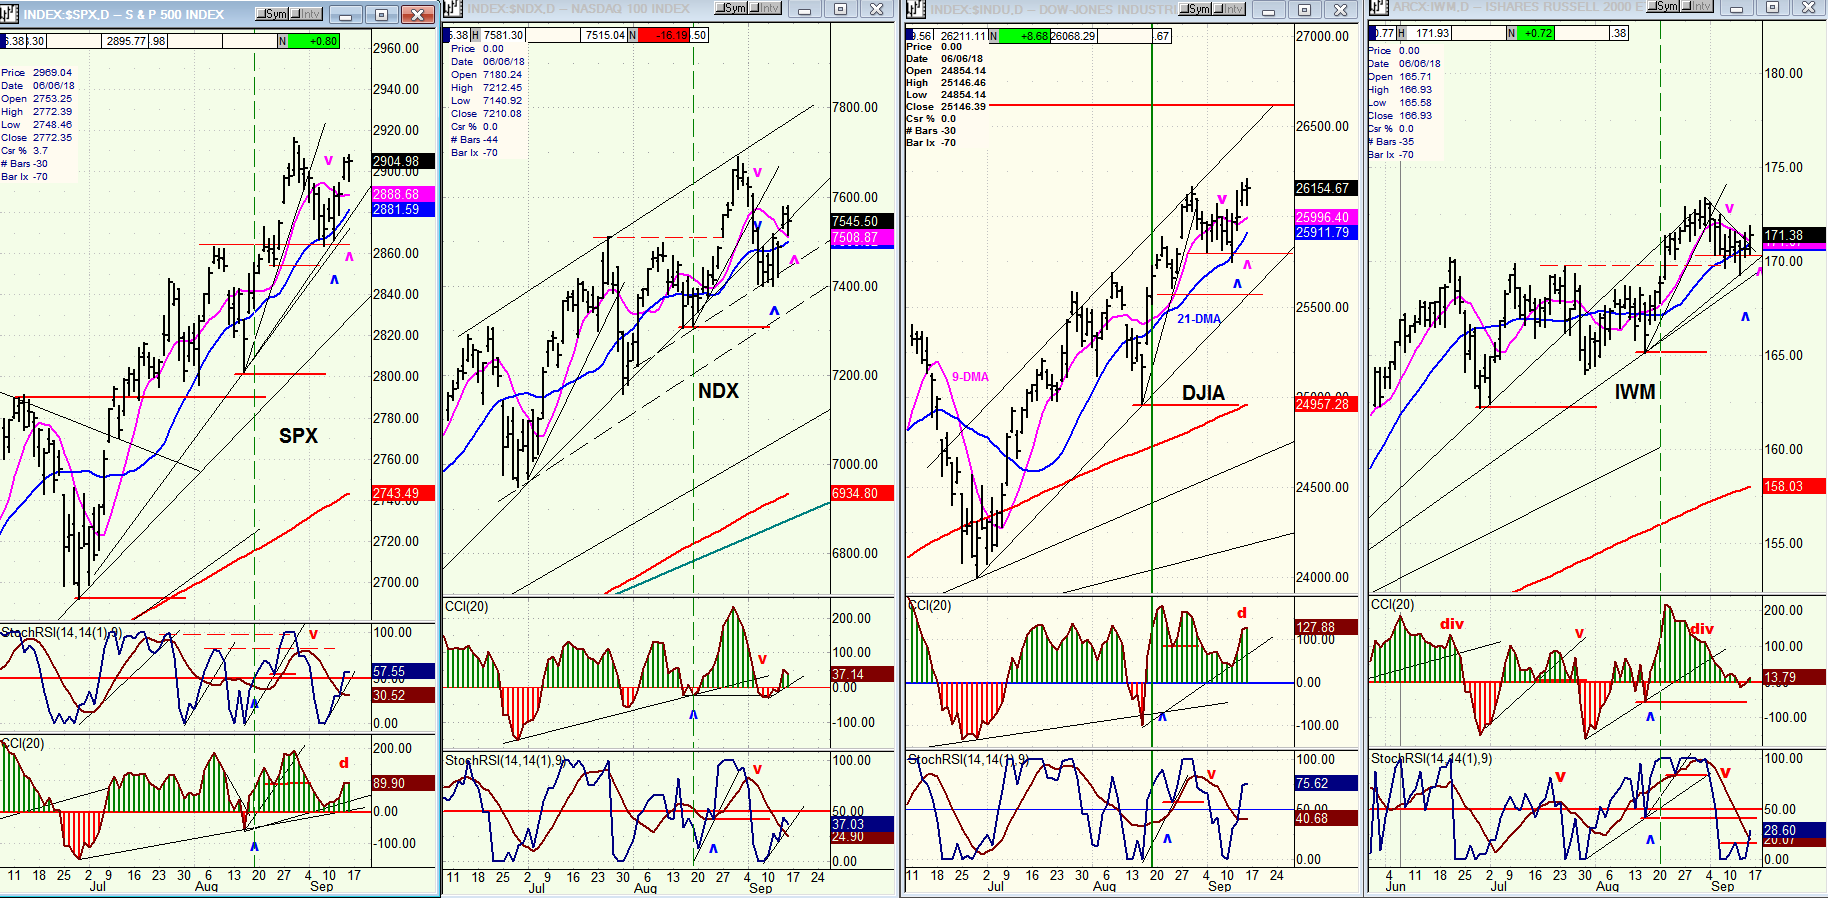
Last week, DJIA made a recovery high by thirteen points, and that helped SPX to rally also. NDX and IWM also rallied, but less aggressively with IWM being the laggard and participating only after making an intra-week low. I would think that if the market were on its way to making a new high, IWM would be in the lead, as it was just before SPX made a new high of 2916. Since then, however, it has receded to the role of a reluctant follower.
DJIA’s recovery high still keeps it short of its January high which is at the level of the red line, above
UUP (dollar ETF) weekly
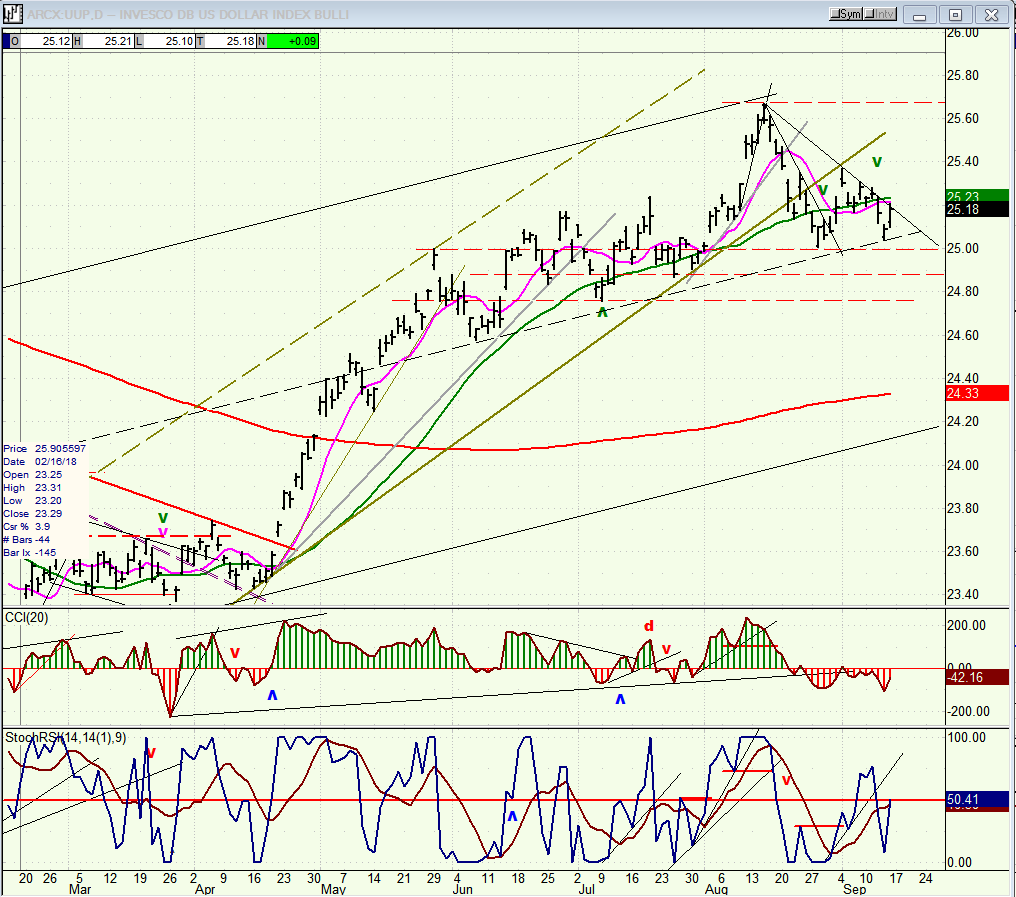
UUP is not anxious to correct, and it may not until this whole tariff business is over. I had thought that it would come down to 25.00 and start a new distribution pattern on the P&F chart (1/2 point reversal), but it has thus far remained above 25.00. Since the entire base calls for a new high of 28.00, it may get there without any further consolidation -- especially if the trade war continues to escalate.
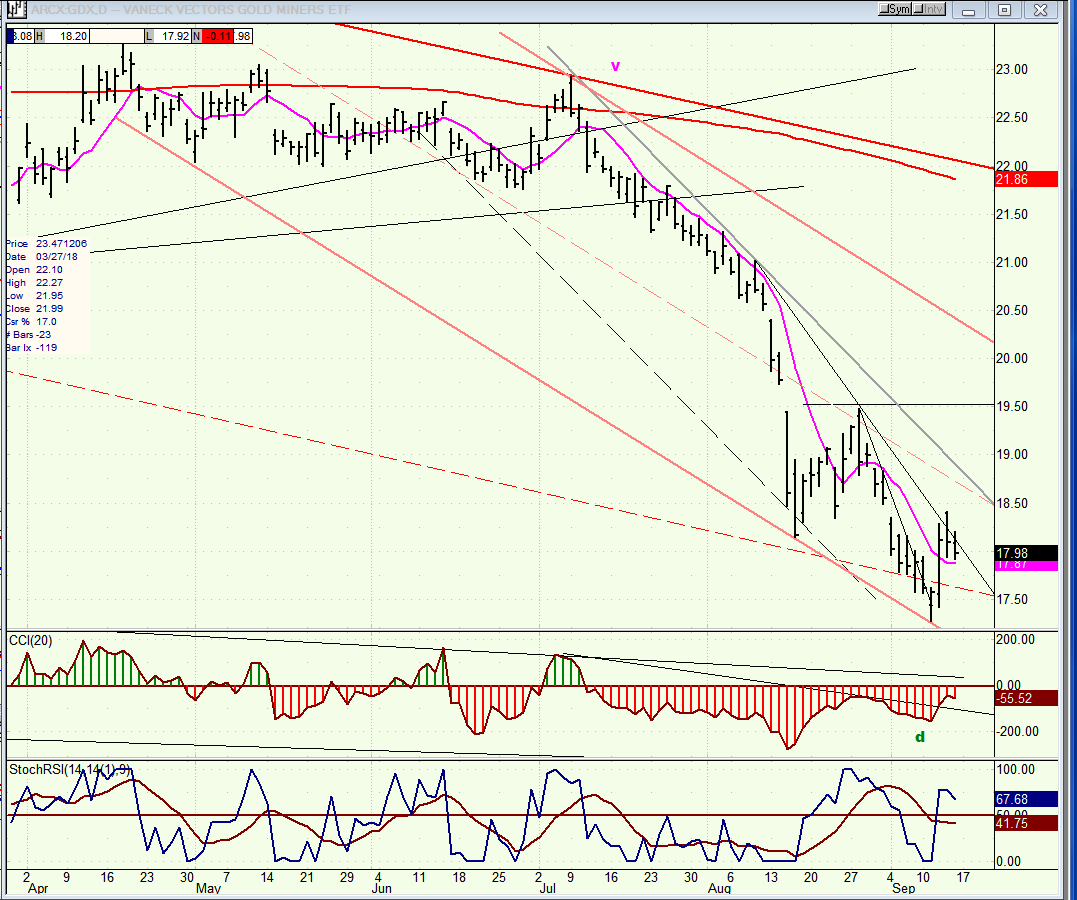
GDX (Gold miners ETF) weekly
While GDX had an uptick from its low, I don’t see it making a substantial recovery as long as UUP remains strong -- unless historical patterns happen to be changing. At the very least, GDX should build a base at the level of its current low (and it may even need to go a little lower) before starting that process. Of course, if the trade conflict is resolved quickly, this would speed up the index’s recovery.
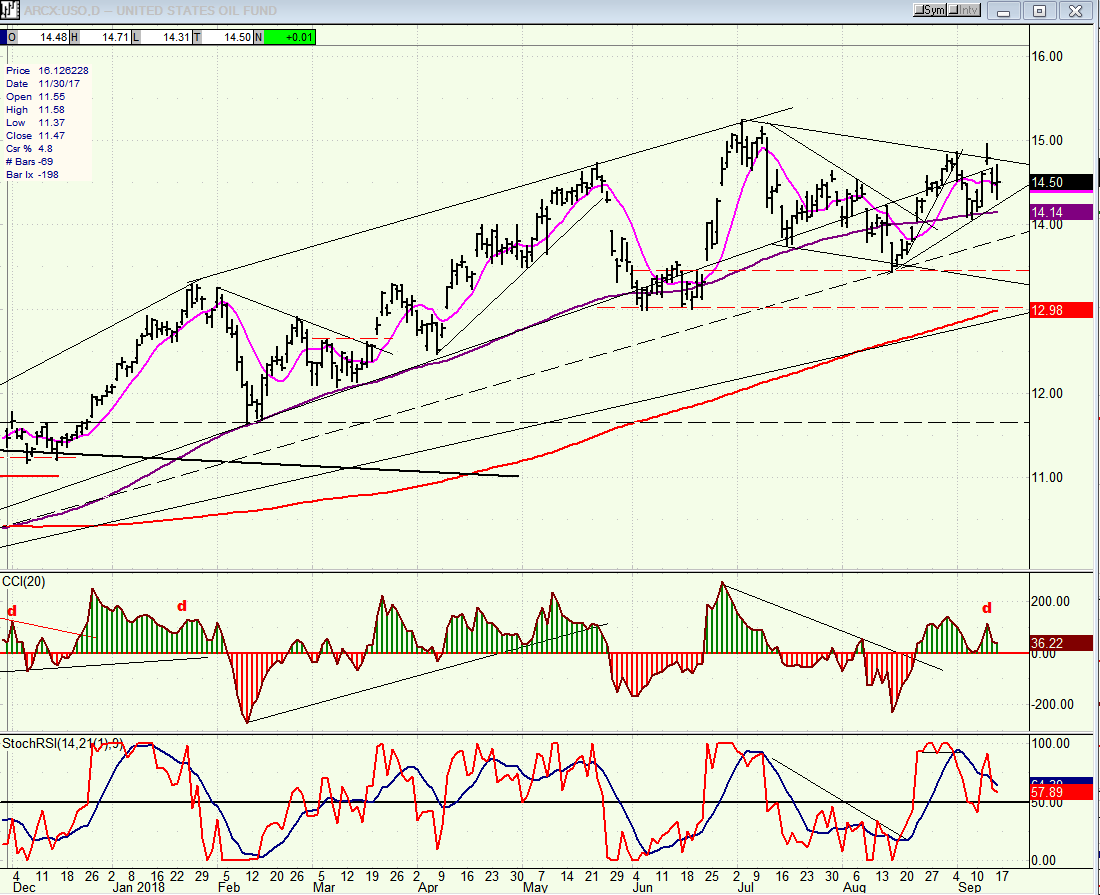
USO (United States Oil Fund)
USO is holding up well, but I would not rush it, and the chart would would look much better if it corrected down to about 13.50 again before attempting a recovery high.
Summary
Last week, I had suggested that SPX could have an a-b-c correction before resuming its long-term uptrend toward its final bull market high of 3000+. If last week brought us wave-b, we should now be ready for an extension of the correction into mid-October in the form of a c-wave.
FREE TRIAL SUBSCRIPTON
With a trial subscription, you will have access to the same information that is given to paid subscribers, but for a limited time period. I think you will find that knowing how far a move can carry is one of the most useful benefits of this service, whether you are a trader or an investor -- especially when this price target is confirmed by reliable indicators which give advance warning of a market top or bottom. Furthermore, cycle analysis adds the all- important time element to the above price projections.
For a FREE 4-week trial, further subscription options, payment plans, and for general information, I encourage you to visit my website at www.marketurningpoints.com.
The above comments about the financial markets are based purely on what I consider to be sound technical analysis principles. They represent my own opinion and are not meant to be construed as trading or investment advice, but are offered as an analytical point of view which might be of interest to those who follow stock market cycles and technical analysis.

When Andre Gratian was a stock broker years ago, a friend introduced him to technical analysis of the market. Consequently, it is not an exaggeration to say that Andre fell in love with this approach! Ever since then, it has become an increasingly important part of his professional life. Gratian has studied the works of Wyckoff, Edwards & Magee, Edward J. Dewey (cycles) and many others. However, one of my most profitable undertaking has probably been to study Point & Figure charting, which he finds invaluable in analyzing stocks and indices. If he were restricted to one methodology, this is the one that he would choose. This well-rounded background has given him what he feels to be a special insight into the stock market, facilitating the recognition of meaningful patterns and the ‘turning points’ in all trends, whether they be short or long term. Andre feels very comfortable discussing the stock market and passing on meaningful information to others. His subscribers include individuals and money managers throughout the world. Moreover, his Newsletters are currently published on several financial sites, here and abroad.


