The True Causes Behind The Yield Curve Inversion And Gold
 share
share
 share
share
 share
share
 share
share
 share
share
By now, everyone and their brother has heard about the yield curve inversion. How come it has inverted and how much should we read into it? Is it really such a reliable indicator of an upcoming recession? Let’s dig into the true causes behind the inversion and find out what its meaning for the gold market.
Is the yield curve inverted? Well, it depends. Although the spread between the U.S. 10-year and 3-month Treasuries has normalized somewhat in September, it remained in negative territory. Meanwhile, after a short dip below zero in August, the spread between the U.S. 10-year and 2-year Treasuries spent time in positive territory, as the chart below shows.
Chart 1: Spread between US 10-year and 3-month Treasuries (blue line, daily numbers, in %) and spread between US 10-year and 2-year Treasuries (green line, daily numbers, in %) from January 2019 to September 2019
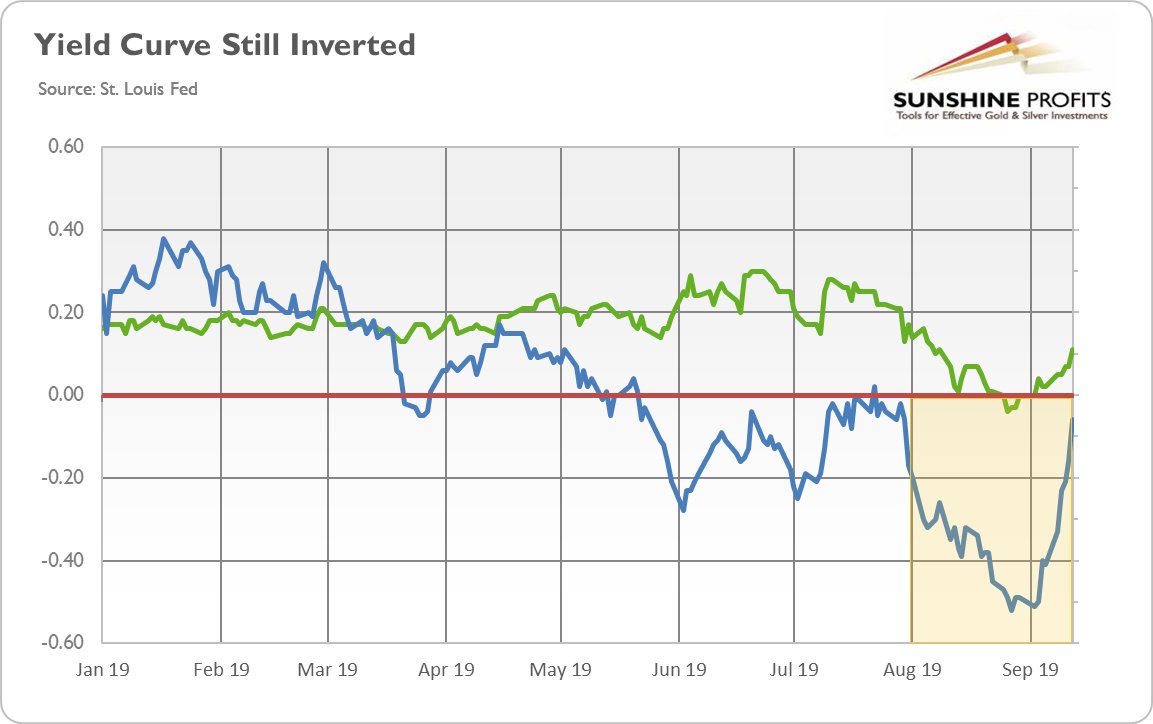
Which spread should we trust? The literature says that the best results are obtained empirically by taking the difference between two Treasury yields whose maturities are far apart. Using the three-month Treasury rate (the overnight rate) at the short end is appropriate. When used in combination with the ten-year Treasury rate to predict U.S. recessions, it provides a reasonable combination of accuracy and robustness over long time periods. Thus, the U.S. yield curve has been inverted since mid-May, which constitutes a powerful recessionary signal. Indeed, that signal has been recently (at the turn of August and September) strengthened by the short-lived dive of the spread between 30-year Treasuries and 3-month below zero.
If history is any guide, we should expect a recession next year, possibly even before the presidential elections. Buy some gold, lots of popcorn, sit and watch – it will be fun! Now, a very important thing: this scenario is not written in stone. History does not repeat itself, it only rhymes. So please be aware that the recession may came a bit earlier or later, or it may even decide not to arrive. It would be unlikely, but we cannot exclude it. The yield curve is the most reliable recessionary indicator we have, but it’s not a crystal ball, it’s just an indicator, man!
To use any indicator wisely, we need to understand the broader context. We need more data and a proper background. We need to know the ultimate reasons behind the yield curve inversion. As one can see in the chart below, although the U.S. long-term bond yields have decreased substantially since the end of 2019, the main reason behind the yield curve inversion has been the steady rise in the short-term interest rates that started at the end of 2015.
Chart 2: US 10-year Treasury yields (green line) and US 3-month Treasury yields (blue line) from January 2015 to September 2019.
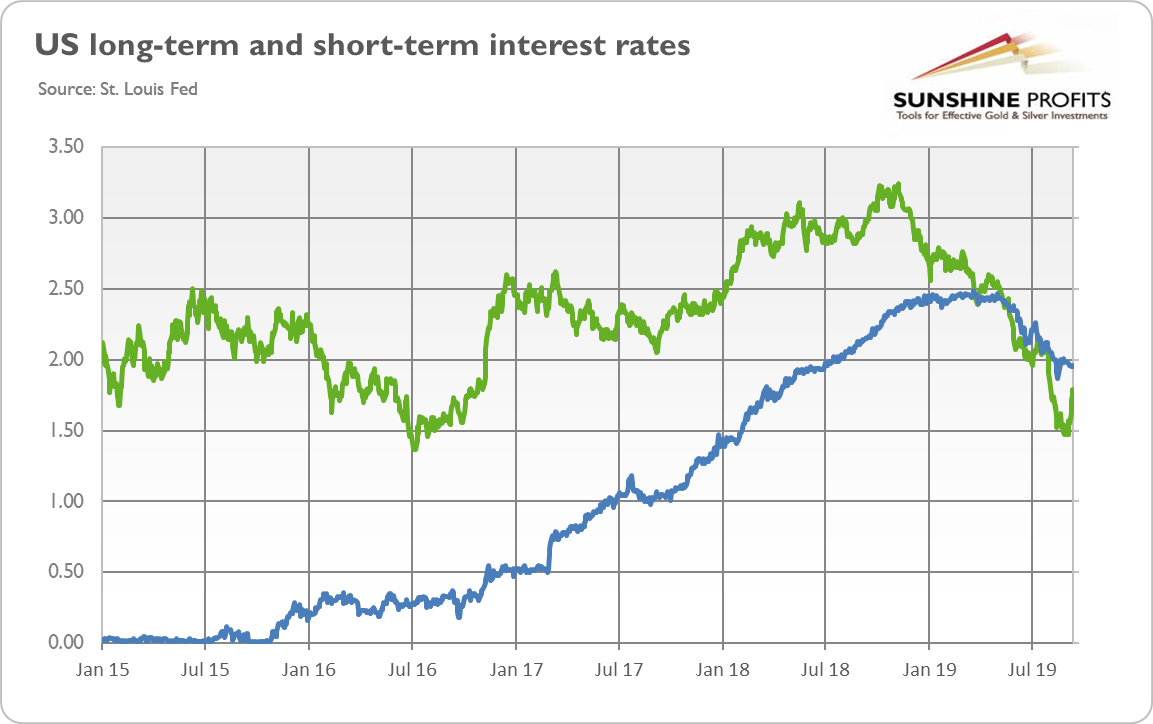
Now, the question is whether the short-term rates climbed because of the decrease in the supply of the U.S. government bonds or due to increasing demand. Although the Fed has been engaged in some quantitative tightening, the unwinding of the U.S. central bank’s balance sheet started only in October 2017 and was rather moderate. Moreover, the federal deficit has been growing since 2015, which means that the Treasury had to issue more bonds and notes to cover the gap between its revenue and spending. It means that the rise in the short-term interest rates was caused by the more intense demand.
The key issue now is what caused that increase in demand. The Austrian theory of the business cycle is helpful here. At the beginning of the cycle, there is an artificial economic boom caused by the low interest rates and credit expansion. Entrepreneurs take advantage of easy money and start many projects that wouldn’t be viable at higher rates. However, the competition makes the inputs more expensive. So, as we approach the peak of the economic expansion, the input prices rises. The rising input prices squeeze profits margins, forcing entrepreneurs to seek short-term financing to complete their business projects. In order to complete the projects, they are ready to borrow money at higher and higher rates. As they demand more funds, the yields, including the Treasury yields, increase. The rising prices also incite the Fed to hike the federal funds rate in order to curb inflation, adding to upward pressure on market interest rates.
What does it all mean? Well, we are approaching the end of the boom. The next phase is a bust. Nobody knows when exactly it will come and how severe it will be. But it will arrive one day, and sooner rather than later. There shall be corporate bankruptcies then, weeping and gnashing of teeth. However, not for all the people. The bust is gold’s favorite phase, so those making the golden choice will thrive.
If you enjoyed the above analysis and would you like to know more about the fundamentals of the gold market, we invite you to read the October Gold Market Overview report. If you’re interested in the detailed price analysis and price projections with targets, we invite you to sign up for our Gold & Silver Trading Alerts. If you’re not ready to subscribe yet and are not on our gold mailing list yet, we urge you to sign up. It’s free and if you don’t like it, you can easily unsubscribe. Sign up today!
Arkadiusz Sieron
Sunshine Profits‘ Gold News and Gold Market Overview Editor
* * * * *
All essays, research and information found above represent analyses and opinions of Przemyslaw Radomski, CFA and Sunshine Profits' associates only. As such, it may prove wrong and be a subject to change without notice. Opinions and analyses were based on data available to authors of respective essays at the time of writing. Although the information provided above is based on careful research and sources that are believed to be accurate, Przemyslaw Radomski, CFA and his associates do not guarantee the accuracy or thoroughness of the data or information reported. The opinions published above are neither an offer nor a recommendation to purchase or sell any securities. Mr. Radomski is not a Registered Securities Advisor. By reading Przemyslaw Radomski's, CFA reports you fully agree that he will not be held responsible or liable for any decisions you make regarding any information provided in these reports. Investing, trading and speculation in any financial markets may involve high risk of loss. Przemyslaw Radomski, CFA, Sunshine Profits' employees and affiliates as well as members of their families may have a short or long position in any securities, including those mentioned in any of the reports or essays, and may make additional purchases and/or sales of those securities without notice.
*********
share
share
share
share
share

Arkadiusz Sieroń received his Ph.D. in economics in 2016 (his doctoral thesis was about Cantillon effects), and has been an assistant professor at the Institute of Economic Sciences at the University of Wrocław since 2017. He is a board member of the Polish Mises Institute of Economic Education, author of several dozen scientific publications (including in such periodicals as the Journal of Risk Research, Prague Economic Papers, Quarterly Journal of Austrian Economics, and Research in Economics), and a regular contributor to GoldPriceForecast.com and SilverPriceForecast.com. His two books, Money, Inflation and Business Cycles and Monetary Policy after the Great Recession, are both published by Routledge. Arkadiusz is also a certified Investment Adviser, a long-time precious metals market enthusiast, and a free market advocate who believes in the power of peaceful and voluntary cooperation of people.


