70 Second Market Outlook: Metals, Dollar, Bonds, Stocks, Energy
 share
share
 share
share
 share
share
 share
share
 share
share
Over the past year we have had some really interesting things unfold in the market. Investing or even swing trading has been much more difficult because of all the wild economic data and daily headline news from all over the globe causing strong surges or sell offs almost every week.
For a while there you could not hold a position for more than a week without some type of news event moving the market enough to either push you deep in the money or get stopped out for a loss. This has unfortunately caused a lot of individuals to give up on trading which is not a good sign for the financial market as a whole.
The key to navigating stocks which everyone thinks are overbought is to trade small position sizes and focus on the shorter time frames like the 4 hour charts. This chart is my secret weapon and giving you both large price swings which daily chart traders focus on while also showing clear intraday patterns to spot reversals or continuation patterns with precise entry/exit points.
While I could ramble on about why the stock market is primed for major long term growth from this point forward I will keep things short and simple with some 4 hour and daily charts for you to see what I see and what I am thinking should unfold moving forward.
Keep in mind, the most accurate trading opportunities that happen week after week are the quick shifts in sentiment which only last 2-5 days at most which is what most of my charts below are focusing on…
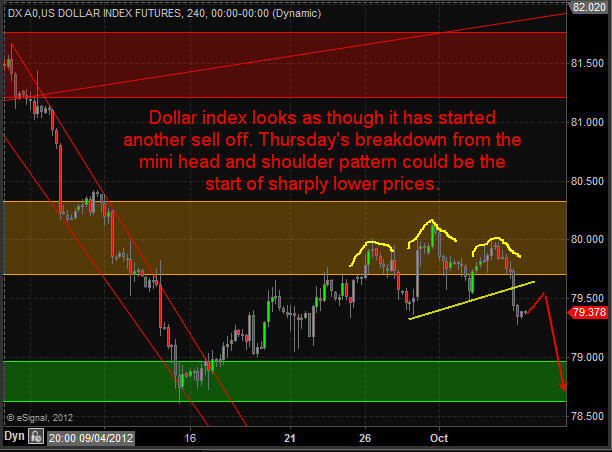
Dollar Index - 4 Hour Chart
This chart shows a mini Head & Shoulders reversal pattern and likely target over the next five sessions. The dollar index has been driving the market for the past couple years so a lower dollar means higher stock and commodity prices.
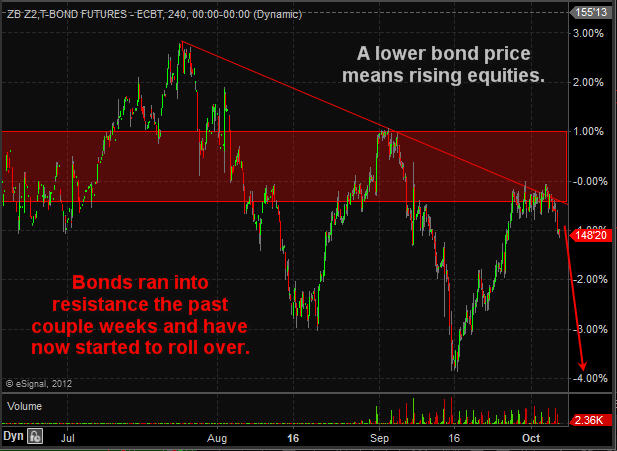
Bond Futures - 4 Hour Chart
Money has been flowing into bonds for the past couple weeks with most traders and investors expecting a strong correction in stocks. As you can see the price of bonds hit resistance this week and as of Thursday has now started selling off. Money flowing out of this "Risk Off" asset means money will move to the "Risk On" investments like stocks and commodities.
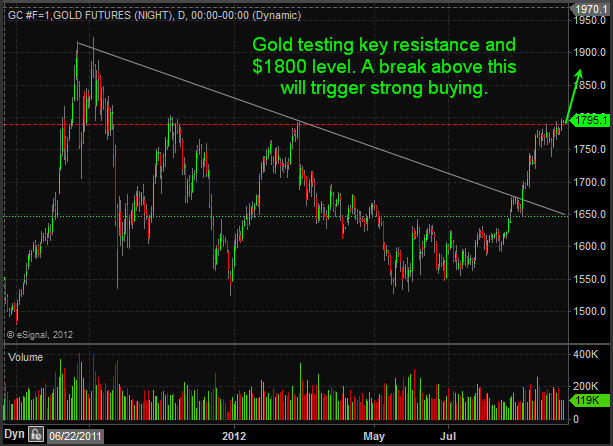
Gold Futures - Daily Chart
Gold is stuck in both categories in my opinion. It is a "Risk Off" safe haven when people are scared of falling stock prices, and it is also a "Risk On" speculative investment when people are feeling good about the market. Gold has been trading at key resistance for a couple weeks and looks as though it's starting its next rally.
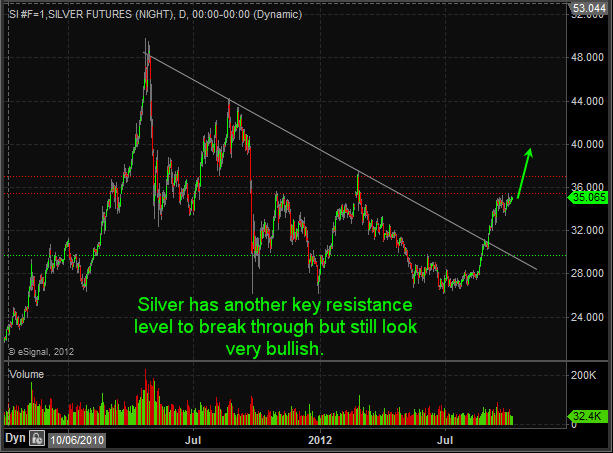
Silver Futures - Daily Chart
Silver is in the same boat as gold though it carries much more volatility than gold. Expect 2-4% swings regularly and sloppy chart patterns in this metal.
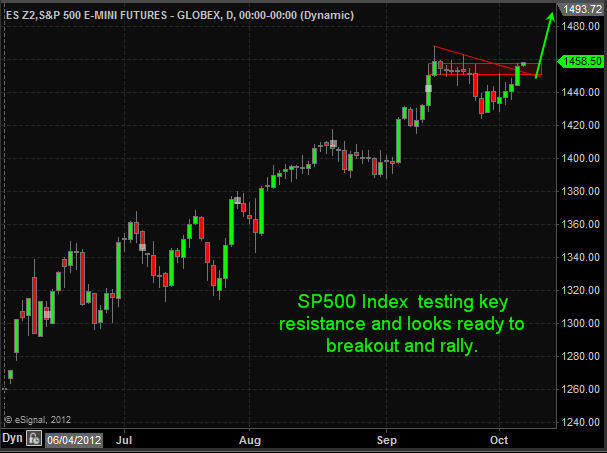
S&P500 Futures - Daily Chart
As much as everyone hates to buy stocks up at these lofty prices I hate to say it but I think they are going to keep going up and they could do this for a long time yet. If the dollar index continues to break down then I expect the SP500 to rally another 3% from here (1500) in the next 1-2 weeks.
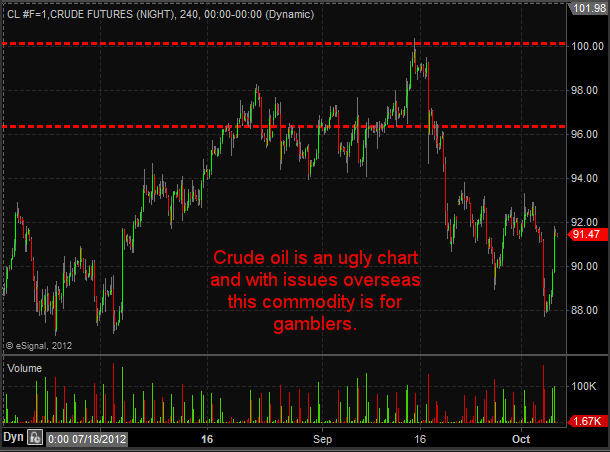
Crude Oil Futures - 4 Hour Chart
Crude oil has not had much attention from me in the past few months. While it has had big price action many of those big days took place on news causing an instant price movement making this extra dangerous to trade. I continue to watch rather than get attached to it.
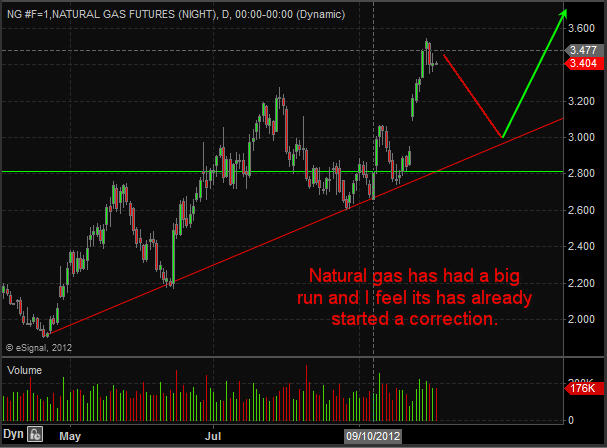
Natural Gas Futures - Daily Chart
Natural gas has been a great performer for us in the past 6 months as all the short positions slowly get covered. I just closed out my natural gas ETF trade this week with a 31.9% gain and plan on getting back in once the chart provides another low risk setup.
Trading Conclusion
In short, I feel the dollar index along with bonds will correct over the next few weeks. That will trigger buying in stocks and commodities. Keep in mind natural gas dances to its own drum beat. The dollar does not have much effect on its price and most times natural gas is doing the opposite of the broad market.
share
share
share
share
share

Chris Vermeulen has been involved in the markets since 1997 and is the founder of Technical Traders Ltd. He is an internationally recognized technical analyst, trader, and is the author of the book: 7 Steps to Win With Logic
Through years of research, trading and helping individual traders around the world. He learned that many traders have great trading ideas, but they lack one thing, they struggle to execute trades in a systematic way for consistent results. Chris helps educate traders with a three-hour video course that can change your trading results for the better.
His mission is to help his clients boost their trading performance while reducing market exposure and portfolio volatility.
He is a regular speaker on HoweStreet.com, and the FinancialSurvivorNetwork radio shows. Chris was also featured on the cover of AmalgaTrader Magazine, and contributes articles to several financial hubs like MoneyShow.com.


