Do Oil Stocks Have Better Upside Potential Than Crude Oil?


In the previous week the price of crude oil not only dropped below the psychological barrier of $100, but also reached a new four-month low of $95.95. On the other hand, the buyers managed to push light crude higher at the end of the last week. Earlier this week we saw further improvement and the price climbed to almost $99 per barrel.
Taking the above circumstances into account, you are probably wondering what impact they had on oil stocks. Before we examine the current situation with the oil stock index, let’s focus on the relationship between the WTI and the XOI in the short term.
At the beginning of the previous week, we saw strong negative correlation between light crude and oil stocks. Crude oil declined below the 50% Fibonacci retracement level and broke below the lower border of the declining trend channel. At the same time, the oil stock index continued its rally and reached a new monthly high. The relationship between the WTI and the XOI reversed on Wednesday and we noticed declines on both daily charts. On Thursday, crude oil hit a new monthly low. Meanwhile, oil stocks hit the bottom of the corrective move. In the following days we saw growths in both cases. The XOI reached a new monthly high and crude oil came back in the range of the declining trend channel.
Although WTI and XOI have been moving in the same direction in recent days, it seems that after weeks of negative correlation it’s still too early to say that this is a meaningful reversal of the current tendency – especially, when we take into account yesterday’s price action in both cases. On Tuesday, the oil stock index hit a fresh monthly high at 1,481 and broke above the 78.6% Fibonacci retracement level. Meanwhile, crude oil dropped to the lower border of the declining trend channel, which confirms the assumption that the recent positive correlation might be just a temporary phenomenon.
With the above in mind, let's take a look at the NYSE Arca Oil Index (XOI) charts to find out what the current situation in the oil stock market is. Let’s start with a look at the long-term chart (charts courtesy by http://stockcharts.com).
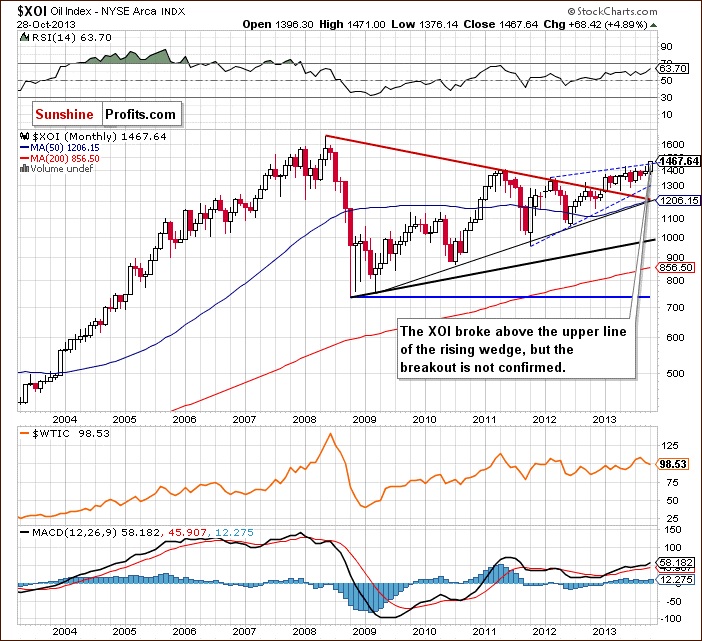
On the above chart we see that the XOI broke above the upper line of the rising wedge. The breakout, however, is not yet confirmed. Please note that in this area there’s a very important Fibonacci retracement level - 78.6% (close to 1,467) based on the entire May-October 2008 decline, which may slow the rally. However, if the buyers don’t give up and manage to push the oil stock index above this resistance, we will likely see further growth.
The XOI still remains above the previously-broken long-term declining resistance line based on the 2008 and 2011 highs and the breakout hasn’t been invalidated. Therefore, taking these observations into account, the situation is very bullish.
To see this more clearly, let’s zoom in on our picture and move on to the weekly chart.
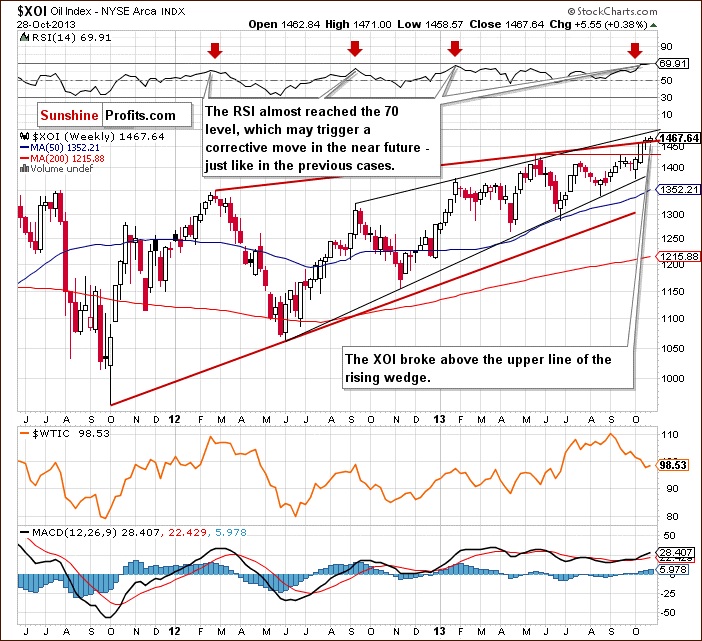
As you can see on the above chart, the oil stock index continued its rally in the previous week and broke above the upper line of the rising wedge (marked with the red bold line). However, the breakout is not confirmed at the moment.
Please note that earlier this week, the buyers pushed the XOI higher, which resulted in a new monthly high at 1,481. At this point, it’s worth mentioning that this area is reinforced by the upper line of the smaller rising wedge (marked with the black line) - currently around 1,480. Therefore, further increases may be restrained by this resistance, especially when we take into account the position of the RSI. This indicator almost reached the 70 level, which may indicate a corrective move in the near future. Please note that we saw similar price action several times in the previous months.
Nevertheless, from the medium-term point of view, the uptrend is not threatened at the moment, and the situation remains bullish.
Now, let’s turn to the daily chart.
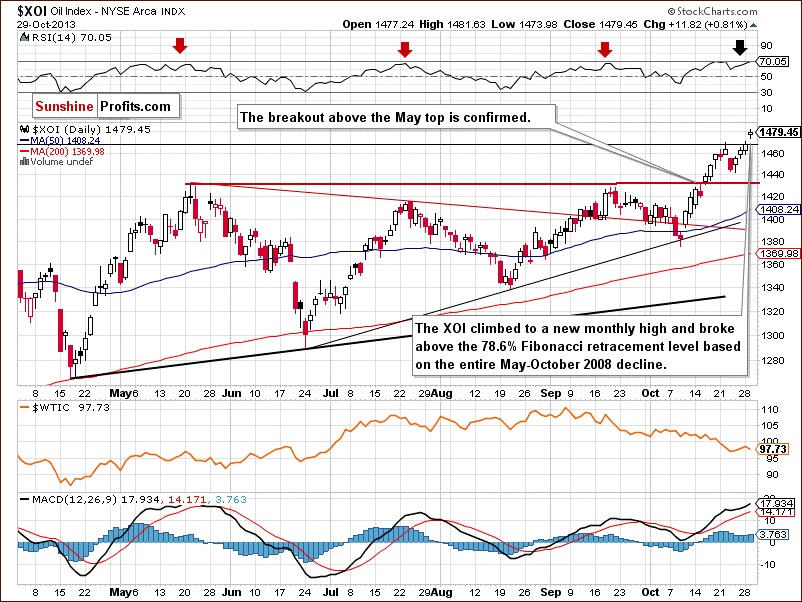
Looking at the above chart, we see that at the beginning of the previous week, the XOI broke above the Oct. 18 high and climbed to a new monthly top at 1,470. In this way, the XOI broke above the 78.6% Fibonacci retracement level (close to 1,467) based on the entire May-October 2008 decline. However, this strong resistance level stopped further increases and encouraged sellers to trigger a correction. Although they pushed the oil stock index to 1,441, this deterioration was only temporary and oil stocks rebounded at the end of the week.
Yesterday, the oil stock index continued its rally and hit a fresh monthly high at 1,481. With this growth, oil stocks broke above the 78.6% Fibonacci retracement level (close to 1,467) based on the entire May-October 2008 decline and closed the day above it, which is a strong bullish sign. If the breakout above this strong resistance is confirmed and the buyers push the XOI higher, we may see further increase to the psychological barrier of 1,500. If this resistance level is broken, the next target level will be around 1,560.
However, we should keep in mind that the RSI almost reached the 70 level, which is a bearish sign. Therefore, we may see a corrective move in the near future. Please note that we saw similar price action several times in the previous months (marked with red arrows on the above chart).
Looking at the daily chart we can see a gap between Monday’s high and yesterday’s open (1,471-1,473.98), which serves now as support. The next support level is the bottom of the recent corrective move at 1,441. A further one lies at 1,428-1,430 and it is based on the May and September highs.
Summing up, from the long-, medium- and short-term perspectives the outlook for oil stocks remains bullish and the uptrend is not threatened at the moment. Taking into account the combination of resistance levels and the position of the RSI, we should keep an eye on the oil stock index because the sellers may trigger a correction in the coming days. However, if they fail and oil stocks confirm the breakout above the 78.6% Fibonacci retracement level and the upper line of the smaller rising wedge (marked with the black line on the weekly chart), we will likely see further growth to at least 1,500. If this level is taken out, the next strong resistance will be around 1,560.
Thank you.
Nadia Simmons
Sunshine Profits‘ Crude Oil Expert
* * * * *
Disclaimer
All essays, research and information found above represent analyses and opinions of Nadia Simmons and Sunshine Profits' associates only. As such, it may prove wrong and be a subject to change without notice. Opinions and analyses were based on data available to authors of respective essays at the time of writing. Although the information provided above is based on careful research and sources that are believed to be accurate, Nadia Simmons and his associates do not guarantee the accuracy or thoroughness of the data or information reported. The opinions published above are neither an offer nor a recommendation to purchase or sell any securities. Nadia Simmons is not a Registered Securities Advisor. By reading Nadia Simmons’ reports you fully agree that he will not be held responsible or liable for any decisions you make regarding any information provided in these reports. Investing, trading and speculation in any financial markets may involve high risk of loss. Nadia Simmons, Sunshine Profits' employees and affiliates as well as members of their families may have a short or long position in any securities, including those mentioned in any of the reports or essays, and may make additional purchases and/or sales of those securities without notice.
More from Gold-Eagle


