The Dow, Dollar & Gold What Goes Down Must Come Up


This year has been a very exiting time for traders and investors. We have seen a steady climb in prices with controlled pullbacks in the broad market and gold.
Using technical analysis we are able to quickly and accurately make informed decisions just from looking at the charts. In the charts below you will see how simple chart patterns along with support & resistance levels can provide excellent low risk entry points. Also you will see how candle stick charts can be an early indicator for prices to reverse direction.
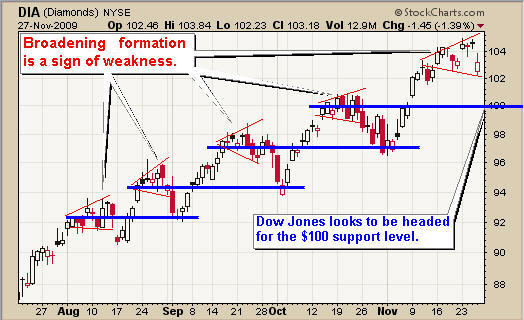
DIA ETF - Daily
The DIA (Dow Jones Index Fund) is trending higher. By applying some basic technical analysis you are able to time your entry points having the odds in your favor.
In this chart I use two simple forms of analysis. The broadening formation (red trend lines), and horizontal support zones shown in blue.
Broadening Formations: This is when the price becomes more volatile making higher highs and lower lows. I think of it as one of those Megaphones for talking to large groups of people. So when a chart has this pattern it's virtually yelling at me and I start taking profits or tightening my stops.
Horizontal Support Zones: I like to focus on support or resistance zones which are a little different than most traders. I do not use the top and bottoms of previous waves for these levels. Instead I take the average price then expect the support level to be penetrated somewhat as the level is tested. This is how the market keeps you out of the good trades. I cover this in great detail in my Stock Market Trading Education Course available in January.
Analysis: The DIA ETF looks ready for a pullback to the $99- 100 level.
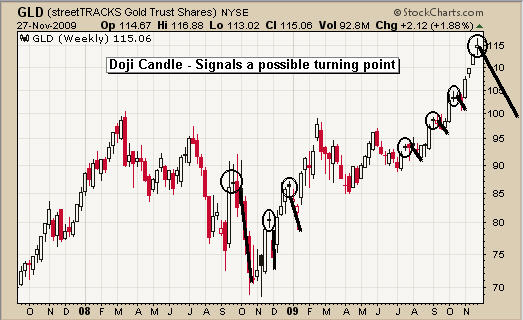
GLD Exchange Traded Fund - Weekly
Gold has been on fire and riding this wave up has been very profitable thus far. Last week a doji candle was formed on the chart and this can signal a change in short term price action.
This chart shows some of the past doji candles and what happened to the price of gold soon after. What this candle is telling us is that the buying and selling pressure is equal. So we know momentum is slowing and we should expect a consolidation or correction.
Because gold has rocketed higher, indeed going almost straight up in the recent weeks, I expect a pullback to be very quick. A drop to the $110 or even the $100 level in the coming weeks is not out of the question, but we all know commodities can go parabolic for several months (straight up). This is why we continue to tighten our stops and keep holding out long positions.
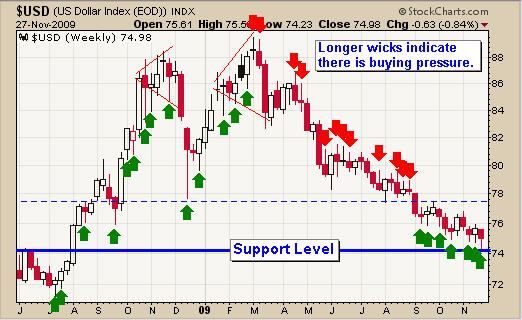
US Dollar - Weekly
The US dollar has been up and down like a yo-yo in the past 15 months. The chart below clearly shows what has been happening with this currency and what I think we could see very soon.
The blue support zone (73-74) is a key pivot point for the dollar. That being said lets take a look at the chart.
During the time when the price is trending higher July 2008 - Feb 2009 we see lower wicks appear more often. This tells me that sellers pushed the price down early in the week but were then overcome by buyers nearer the end of the week. This is bullish price action. Also the broadening patterns during this timeframe's tops indicate increased volatility and we know that is a sign of weakness.
From March 2009 - Sept 2009 the trend was down and there are longer upper wicks telling us buyers became over powered by sellers each time the price rallied.
In the recent 3 months we observe lower wicks meaning buyers are moving into the US dollar again. Knowing that there is major support below the current price I have to think the dollar could start to bottom around this level.
Trading Conclusion
The broad market is becoming unstable and looks like it could have more of a pullback this week. I would not be adding to any long positions until we see the market trading near support. Three out of four stocks move with the market so it is crucial to understand the overall market direction when buying and selling stocks and commodities.
Gold is trading at a level which is fuzzy. The weekly chart is neutral and the daily chart is still on fire as it moves up. All we can do is ride our positions and keep raising our stop prices.
The US dollar could start to bottom over the next few weeks. Depending what happens with Dubai this week we could be in for a big bounce in the dollar as investors flock to safety as the US dollar is still the currency of choice if/when other countries start to have a financial melt down again.

Chris Vermeulen has been involved in the markets since 1997 and is the founder of Technical Traders Ltd. He is an internationally recognized technical analyst, trader, and is the author of the book: 7 Steps to Win With Logic
Through years of research, trading and helping individual traders around the world. He learned that many traders have great trading ideas, but they lack one thing, they struggle to execute trades in a systematic way for consistent results. Chris helps educate traders with a three-hour video course that can change your trading results for the better.
His mission is to help his clients boost their trading performance while reducing market exposure and portfolio volatility.
He is a regular speaker on HoweStreet.com, and the FinancialSurvivorNetwork radio shows. Chris was also featured on the cover of AmalgaTrader Magazine, and contributes articles to several financial hubs like MoneyShow.com.


