Gold’s China Takeover


Gold’s monster record bull has resumed galloping higher under new management. Frenzied buying from China has increasingly replaced gold’s usual drivers, American gold-ETF-share and gold-futures trading. This ascendant Chinese gold demand has kept gold running hot, short-circuiting an overdue reckoning necessary for rebalancing. With American traders not fully joining in, gold’s resilience up here depends on China.
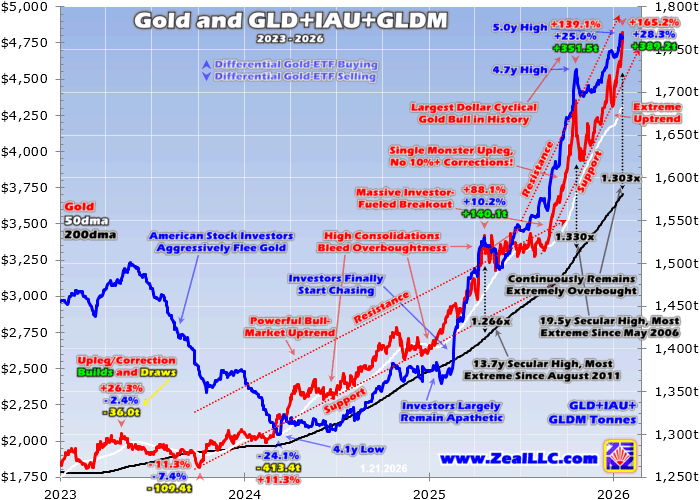
From late July to mid-October 2025, gold skyrocketed 32.9% higher in just 2.7 months! That remarkable span proved extraordinary in many ways. In it gold achieved 24 all-time-record closes, on about 3/7ths of all its trading days. Gold’s strongest up days weren’t clustered at certain times within trading weeks, but distributed fairly randomly. American stock investors were enthusiastically chasing gold, forcing it higher.
That was evident in the physical bullion holdings of the world-dominant US gold exchange-traded funds. Those of course are GLD SPDR Gold Shares, IAU iShares Gold Trust, and the newer GLDM SPDR Gold MiniShares. According to the World Gold Council’s latest global gold supply-and-demand update current to Q3’25, GLD+IAU+GLDM together commanded over 3/7ths of all the bullion held by all the world’s gold ETFs!
During that big-and-fast gold rally, GLD+IAU+GLDM holdings surged 10.9% or 169.4 metric tons on massive differential gold-ETF-share buying. That largely catapulted gold way up to $4,350 back in mid-October, leaving it exceedingly-overbought. Gold stretched a jaw-dropping 33.0% above its baseline 200-day moving average, ranking as the 7th-most-overbought close out of all trading days since January 1981 or top 0.06%!
Gold’s monster bull had ballooned to astounding 139.1% gains over 24.5 months without a single 10%+ correction! That record-shattering cyclical gold bull had grown to the largest in US-dollar terms since 1971. And that means ever, as that was the year the US dollar was severed from its gold standard. Gold had soared so far so fast relative to its own vast 54.8 years of precedent that a serious reckoning seemed assured.
That should’ve been a big-and-fast selloff, as gold’s next-ten-largest cyclical bulls since 1971 averaged subsequent major drawdowns of 20.8% over just 2.1 months! Gold indeed headed that way, plunging 9.5% in just a couple weeks into early November. That proved gold’s biggest selloff of this epic record bull, knocking on the door of 10%+ correction territory which would formally slay it. Then things got strange.
Before I dive into specifics, that wasn’t evident right away. But something changed dramatically with gold since mid-October’s peak, which is becoming increasingly apparent in hindsight. Between then and this Wednesday, gold has surged another 10.9% higher in a similar 3.1 months. That works out to just under a third of gold’s gains in those 2.7 months into mid-October, with American stock investors really pulling back.
During this latest several-month span, those GLD+IAU+GLDM holdings merely climbed 2.2% or 37.8t. That’s less than 1/4th of their massive build in the prior several months! And literally all of that accrued in just the past 1.2 months since mid-December. These dominant ETFs’ gold-bullion holdings didn’t first regain mid-October’s peak until then, fully 1.9 months later. Gold didn’t start hitting new records until late December.
Gold’s biggest-ever US-dollar cyclical bull miraculously evading a correction out of some of gold’s most-extreme overboughtness in 45+ years sure seemed odd. Reckonings are essential after extreme rallies to rebalance stretched technicals and greedy herd sentiment. Prematurely short-circuiting an underway big-and-fast selloff required massive demand emerging from somewhere, as it wasn’t American stock investors.
But tracking that is challenging, as the global gold market has always been very opaque. The only great global gold supply-and-demand data is just published once a quarter by the World Gold Council. These fantastic Gold Demand Trend reports are released about five weeks after quarter-ends. So the Q4’25 edition that has yet to be published is likely coming in early February. That ought to prove illuminating.
While trying to figure out gold’s anomaly especially in this past month, something caught my attention. Though gold’s big up days prior to mid-October’s peak seemed randomly distributed, since then they have been mostly clustered on Mondays. That’s even more unusual because Mondays in the prior couple decades averaged gold’s weakest day of the week! Yet all gold’s gains since mid-October came on Mondays.
On November 10th gold blasted 2.7% higher out of that near-correction. On November 24th leading into the quiet US Thanksgiving week gold surged 1.8%. On December 22nd kicking off the even-lighter-volume Christmas week, gold blasted up 2.4% hitting its first new record close since mid-October of $4,442. On January 5th gold soared another 2.7%. On January 12th gold racked up another big 1.9% daily gain.
Then its biggest up day by far since mid-October was this Tuesday’s enormous 3.8% surge! While not a Monday, that was effectively one as this week’s first trading day after a Monday holiday. Since that mid-October peak, as of midweek gold has surged $475 higher. Its total gains on those five Mondays and this week’s effective one totaled $661! Way more than all gold’s gains came on just six week-opener trading days!
I’ve been professionally analyzing gold, trading gold stocks, and writing about it all in popular financial newsletters for over a quarter-century now. Doing this I get to watch the markets all day everyday in real-time. After my alarm blares at 4:45am on trading days, the first thing I do is check overnight action in Asia and Europe. Later when I get to my computers I review full intraday price charts from overseas sessions.
Right after every US close, I write a page or two of daily notes including screenshots of relevant intraday charts. I later use those notes as the foundation for our newsletters. Then the last thing I do before I go to bed around 9:45pm leading into trading days is look at what’s happening in Asian markets. When trying to understand outsized price moves, seeing when they occurred relative to material newsflow is crucial.
For example if a big gold move erupts right out of an FOMC decision, that likely explains why. A couple weeks ago as I was thinking about gold’s unusual big Monday gains, I reviewed all my notes from those Mondays which included 24-hour-intraday-gold-chart screenshots. It turned out the great majority of those daily gains happened overnight in Asian trading, many hours before US opens! Later US gains were minor.
So less than 1/10th of all the trading days since mid-October were responsible for way more than gold’s entire surge since, those were all week-openers, and most of those big gains occurred when China was open but Europe and the US were still closed. I coined those unusual days “China Mondays”. Overnight after weekends is the only time Chinese markets are active but most of the rest of the world remains asleep.
That’s when Chinese traders’ buying and selling utterly dominates global price action because there isn’t any competing trading to counterbalance it. China owns late Sunday into early Monday New York time in terms of market influence. Overnight into Tuesdays, Wednesdays, Thursdays, and Fridays that isn’t the case, as major Western markets have extended-hours trading running nearly 24 hours a day within weeks.
Adding to China’s Sunday-night dominance, weekends are the longest blocks of time where traders can’t react to any material news. So some traders square positions and shut down algorithmic trading programs during weekends. And other algorithms left running into early Mondays can have lots of market news reactions to catch up on. These algorithms can amplify China-driven moves in light overnight trading.
Before we continue on China’s recent gold takeover, this chart helps illuminate how different the few months before and after gold’s mid-October peak have been. Massive differential GLD+IAU+GLDM share buying was the primary driver of gold’s far-bigger surge into that, but American stock investors’ demand has been mostly-anemic since. Yet gold has still unusually blasted back up into extreme overboughtness.
While American stock investors weren’t too keen on chasing this China-buying-fueled gold surge until this past month or so, American gold-futures speculators piled in. Their positioning data is only reported once a week, current to Tuesdays. Back in late November right after gold’s second of those six China-Monday surges, total spec gold-futures longs were running 307.0k contracts. They’ve soared in the seven weeks since.
In the latest-available Commitments of Traders report before this essay was published current to Tuesday January 13th, total spec longs had shot back up to 362.4k contracts! That 55.4k jump is the equivalent of 172.2 metric tons of gold buying, more than tripling the 51.6t GLD+IAU+GLDM holdings build in that span. So American speculators buying gold futures chasing China-driven gold momentum amplified gold’s gains.
But that gold-futures buying firepower is quite finite and rapidly depleting. US gold futures allow extreme maximum leverage of 20x to 25x, making trading them incredibly-risky. That greatly limits traders willing to take such risks, who collectively command relatively-small capital pools. Looking at total spec longs and shorts relative to their gold-bull trading ranges offers insights on whether specs are more likely to buy or sell.
As of last Tuesday, total spec longs were running 58% up into their gold-bull trading range since early October 2023 and total spec shorts just 6% up into their own. The most-bullish near-term setup for gold is when spec longs are way down near 0% and spec shorts way up near 100%, leaving only room to buy. The most-bearish is the opposite, 100% longs and 0% shorts. The latest spec positioning is way closer to the latter!
So how long gold can continue powering higher defying a necessary-and-healthy drawdown likely mostly depends on Chinese traders. Unfortunately reliable and consistent market data out of China is difficult to acquire if it even exists, at least in English. And even if we had such data, analyzing it relative to big past gold moves over many years would be required to understand correlations and any implied causations.
But I do read everything I find related to Chinese gold demand, and there are plenty of anecdotal reports in major financial newspapers of frenzied buying. While beyond the scope of this essay, silver’s extreme parabolic moonshot since early December has also been mostly-Chinese-fueled. I suspect the resulting exceedingly-bullish silver sentiment has spilled into gold driving buying, both in China and around the world.
Without extensive data and historical analyses of Chinese gold markets, we Western analysts can’t game how long this strong demand will persist. Herd greed and fear are universal, as are the market behaviors that both help fuel them and result from them. But China’s unique culture which is very different from the US and Europe will help shape Chinese traders’ willingness to continue chasing gold by buying ever-higher.
In the chart above, note that GLD+IAU+GLDM holdings didn’t start surging until halfway through Q1’25. American stock investors had mostly ignored gold for many years, keeping super-low portfolio allocations rounding to zero. Culturally in the West, gold had long been perceived as an anachronistic relic although that is really changing over this past year. But in Chinese culture gold has always been highly-venerated.
Thus Chinese traders as a whole had to start with higher gold enthusiasm than American ones. I suspect that makes them more likely to deploy into gold more aggressively and ride it higher for longer. Chinese investors also have few options to diversify their capital outside of China’s economic system due to strict controls. Yet investing in gold and silver accomplishes that, as their values aren’t dependent on China’s policies.
Chinese culture also has a much-higher emphasis on pursuing wealth and status than American culture. I’ve seen this with my own eyes traveling in China, I’ve read much about it, and I’ve discussed it with Chinese investors I’ve met occasionally over the years in this business. We’ve actually been blessed with lots of newsletter subscribers over the decades from China, reflecting their interest in global gold markets!
So out of all the major countries in the world, China is uniquely suited for a speculative mania in gold. Anecdotal reports suggest one is indeed underway there, and recent months’ China-Monday gold-surge phenomenon buttresses those. But despite many years of digesting everything I came across on Chinese gold markets, my understanding of them barely scratches the surface. They remain largely obscured.
Again I’ve periodically searched for good Chinese gold-market data, to little avail. In that command-and-control economy, financial transparency isn’t valued anywhere near as much as in the West. I’ve found that myself doing quarterly analyses on major gold miners’ latest results, which usually included some large Chinese gold miners. Chinese companies’ financial reporting at least in English is notoriously sparse.
In recent years the Chinese government itself has simply stopped publishing many economic data series common in Western countries. Going dark on those is presumably because their trends must be negative which would reflect poorly on the policies of the ruling Communist Party of China. That has long been a propaganda machine, trying to forcibly shape Chinese opinion on many issues rather than informing it.
China’s central bank even routinely lies about its gold reserves! They are reported by the People’s Bank of China monthly, but few analysts believe those numbers are righteous. As an example, from April 2009 to May 2015 they were continuously declared to be 1,054 metric tons. Then suddenly in June 2015 alone, they were reported to skyrocket 57% to 1,658t! There’s no way that kind of buying happened in a single month.
Most Western gold analysts believe the PBoC has been buying way more gold than reported for many years if not decades now. But if it isn’t honest about its gold holdings, and the Chinese government kills economic data series trending the wrong way, how likely is it Chinese markets are honest and transparent on gold demand there? And what potential catalysts could arise that would scare Chinese traders into fleeing?
I certainly don’t have answers, which makes me nervous. All popular speculative manias historically are soon followed by brutal symmetrical bursts. Those ignite once herd greed climaxes sucking in all-available near-term buyers. That leaves only sellers, quickly collapsing vertical or parabolic markets. Maybe China’s apparent gold speculative mania persists for months, maybe it reverses or pauses next week!
But I do know that this past month’s gold breakout surge has been almost entirely driven during Chinese trading hours overnight into weeks’ opening days unopposed by Western trading. Since December 19th just before gold regained new-record territory for the first time since mid-October, it has soared $487 as of Wednesday. Yet four China-Monday surges in this span account for fully $480 of those gains, effectively all!
That’s not normal, and pretty darned risky. As Chinese stock markets have shown in spades in this past decade, Chinese traders flee hard once spooked quickly collapsing prices. Any day China’s government could do something scaring gold traders, such as new rules to slow or reverse speculative buying. And if American stock investors and American gold-futures speculators aren’t there to take back control, gold will plunge.
Successful trading demands always staying informed on markets, to understand opportunities as they arise. We can help! For decades we’ve published popular weekly and monthly newsletters focused on contrarian speculation and investment. They draw on my vast experience, knowledge, wisdom, and ongoing research to explain what’s going on in the markets, why, and how to trade them with specific stocks.
Our holistic integrated contrarian approach has proven very successful, and you can reap the benefits for only $10 an issue. We extensively research gold and silver miners to find cheap fundamentally-superior mid-tiers and juniors with outsized upside potential. Sign up for free e-mail notifications when we publish new content. Even better, subscribe today to our acclaimed newsletters and start growing smarter and richer!
The bottom line is Chinese trading has taken over gold in recent months. After gold’s biggest bull ever peaked at some of gold’s most-overbought extremes ever in mid-October, a rebalancing drawdown was necessary. Yet that was soon prematurely short-circuited by frenzied gold buying out of China. All of gold’s gains since came overnight into Mondays on just six trading days, when Chinese traders dominate.
While these China-Monday surges drove gold to new breakout records, American stock investors have been slow to chase these gains. American gold-futures speculators have, but their finite capital firepower for buying is depleting. So if manic Chinese gold demand burns itself out or Chinese traders are scared into selling for any reason, gold forced back up deep into extremely-overbought territory here is in real trouble.
*********
More from Gold-Eagle


