Gold Forecast: Another Strong Upleg Looks Imminent As Bull Flag Completes..


After almost 4 years of going nowhere gold has this month broken out into what looks set to be by far its biggest bullmarket to date, and it would be surprising if it wasn’t given the fundamental outlook which is for currency and societal collapse, implosion of the debt and derivatives markets and war and general chaos and mayhem as the prelude to an intended global government involving the imposition of the CBDC (Central Bank Digital Currency) system as part of a total control grid.
Fortunately for investors the situation is now very clear with respect to gold and gold investments and easy and simple to elucidate.
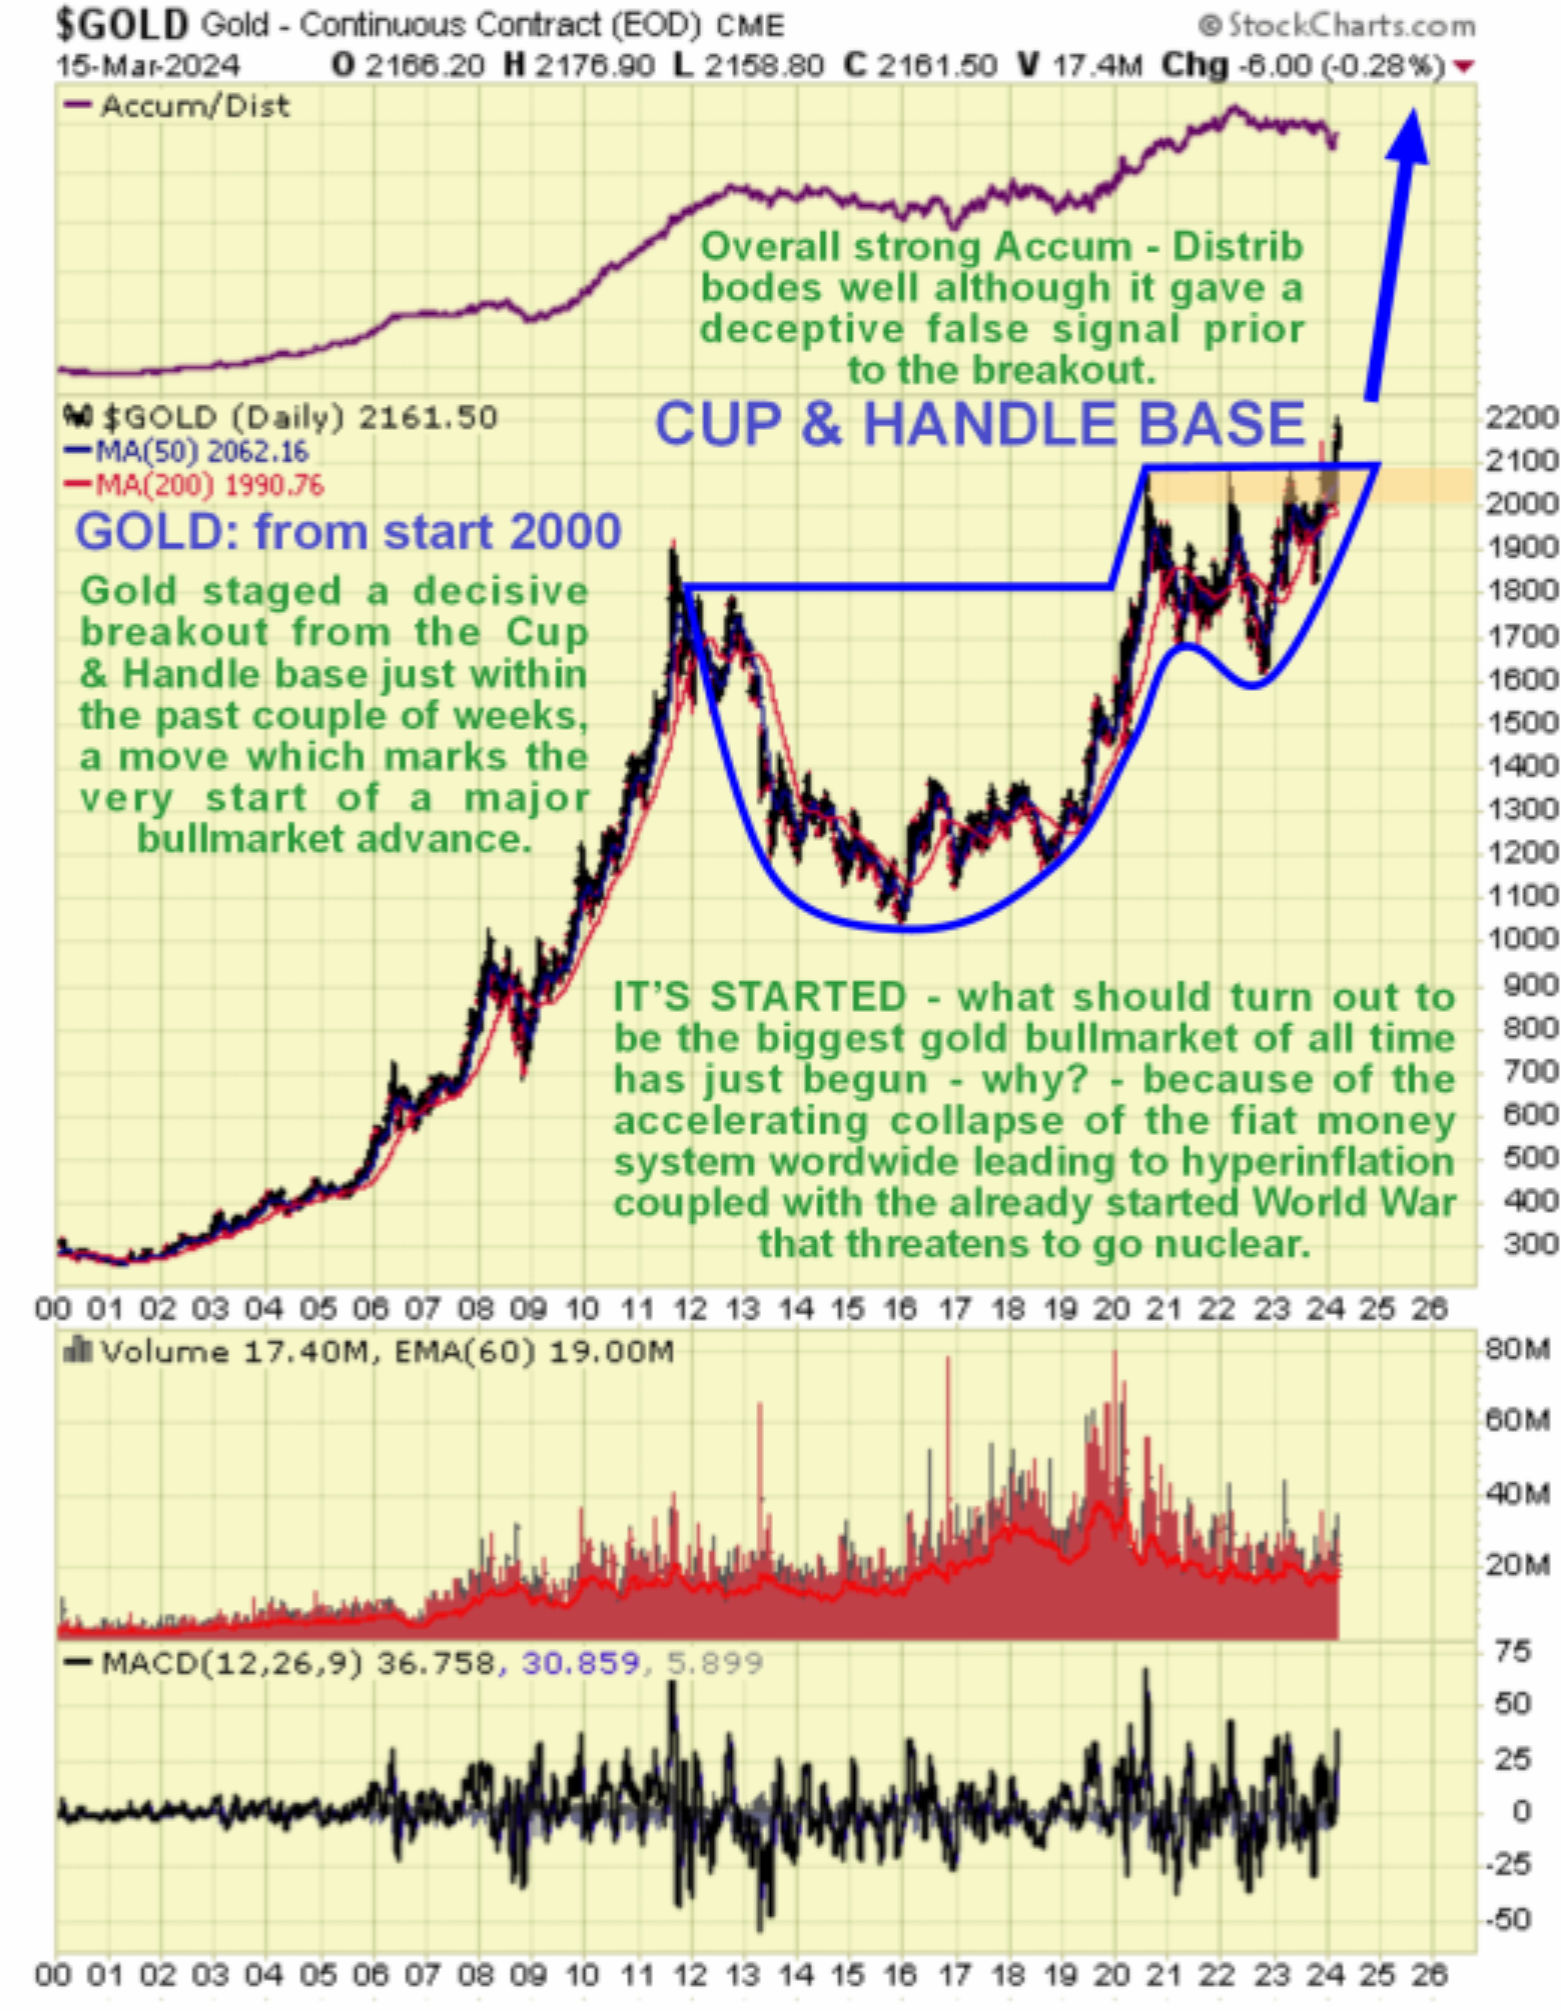
Our very long-term chart going all the way back to the start of the year 2000 shines a giant searchlight on gold’s situation, quickly revealing that beyond the great 2000’s bullmarket, the price has marked out a fine example of a gigantic Cup & Handle base which is of such a magnitude that it can support a massive bullmarket, which as mentioned above is likely to be of unprecedented proportions. The reason for this update now is that it has just this month, at last, broken out of the top of this completed base pattern, so for investors in the sector there is still almost everything to go for.
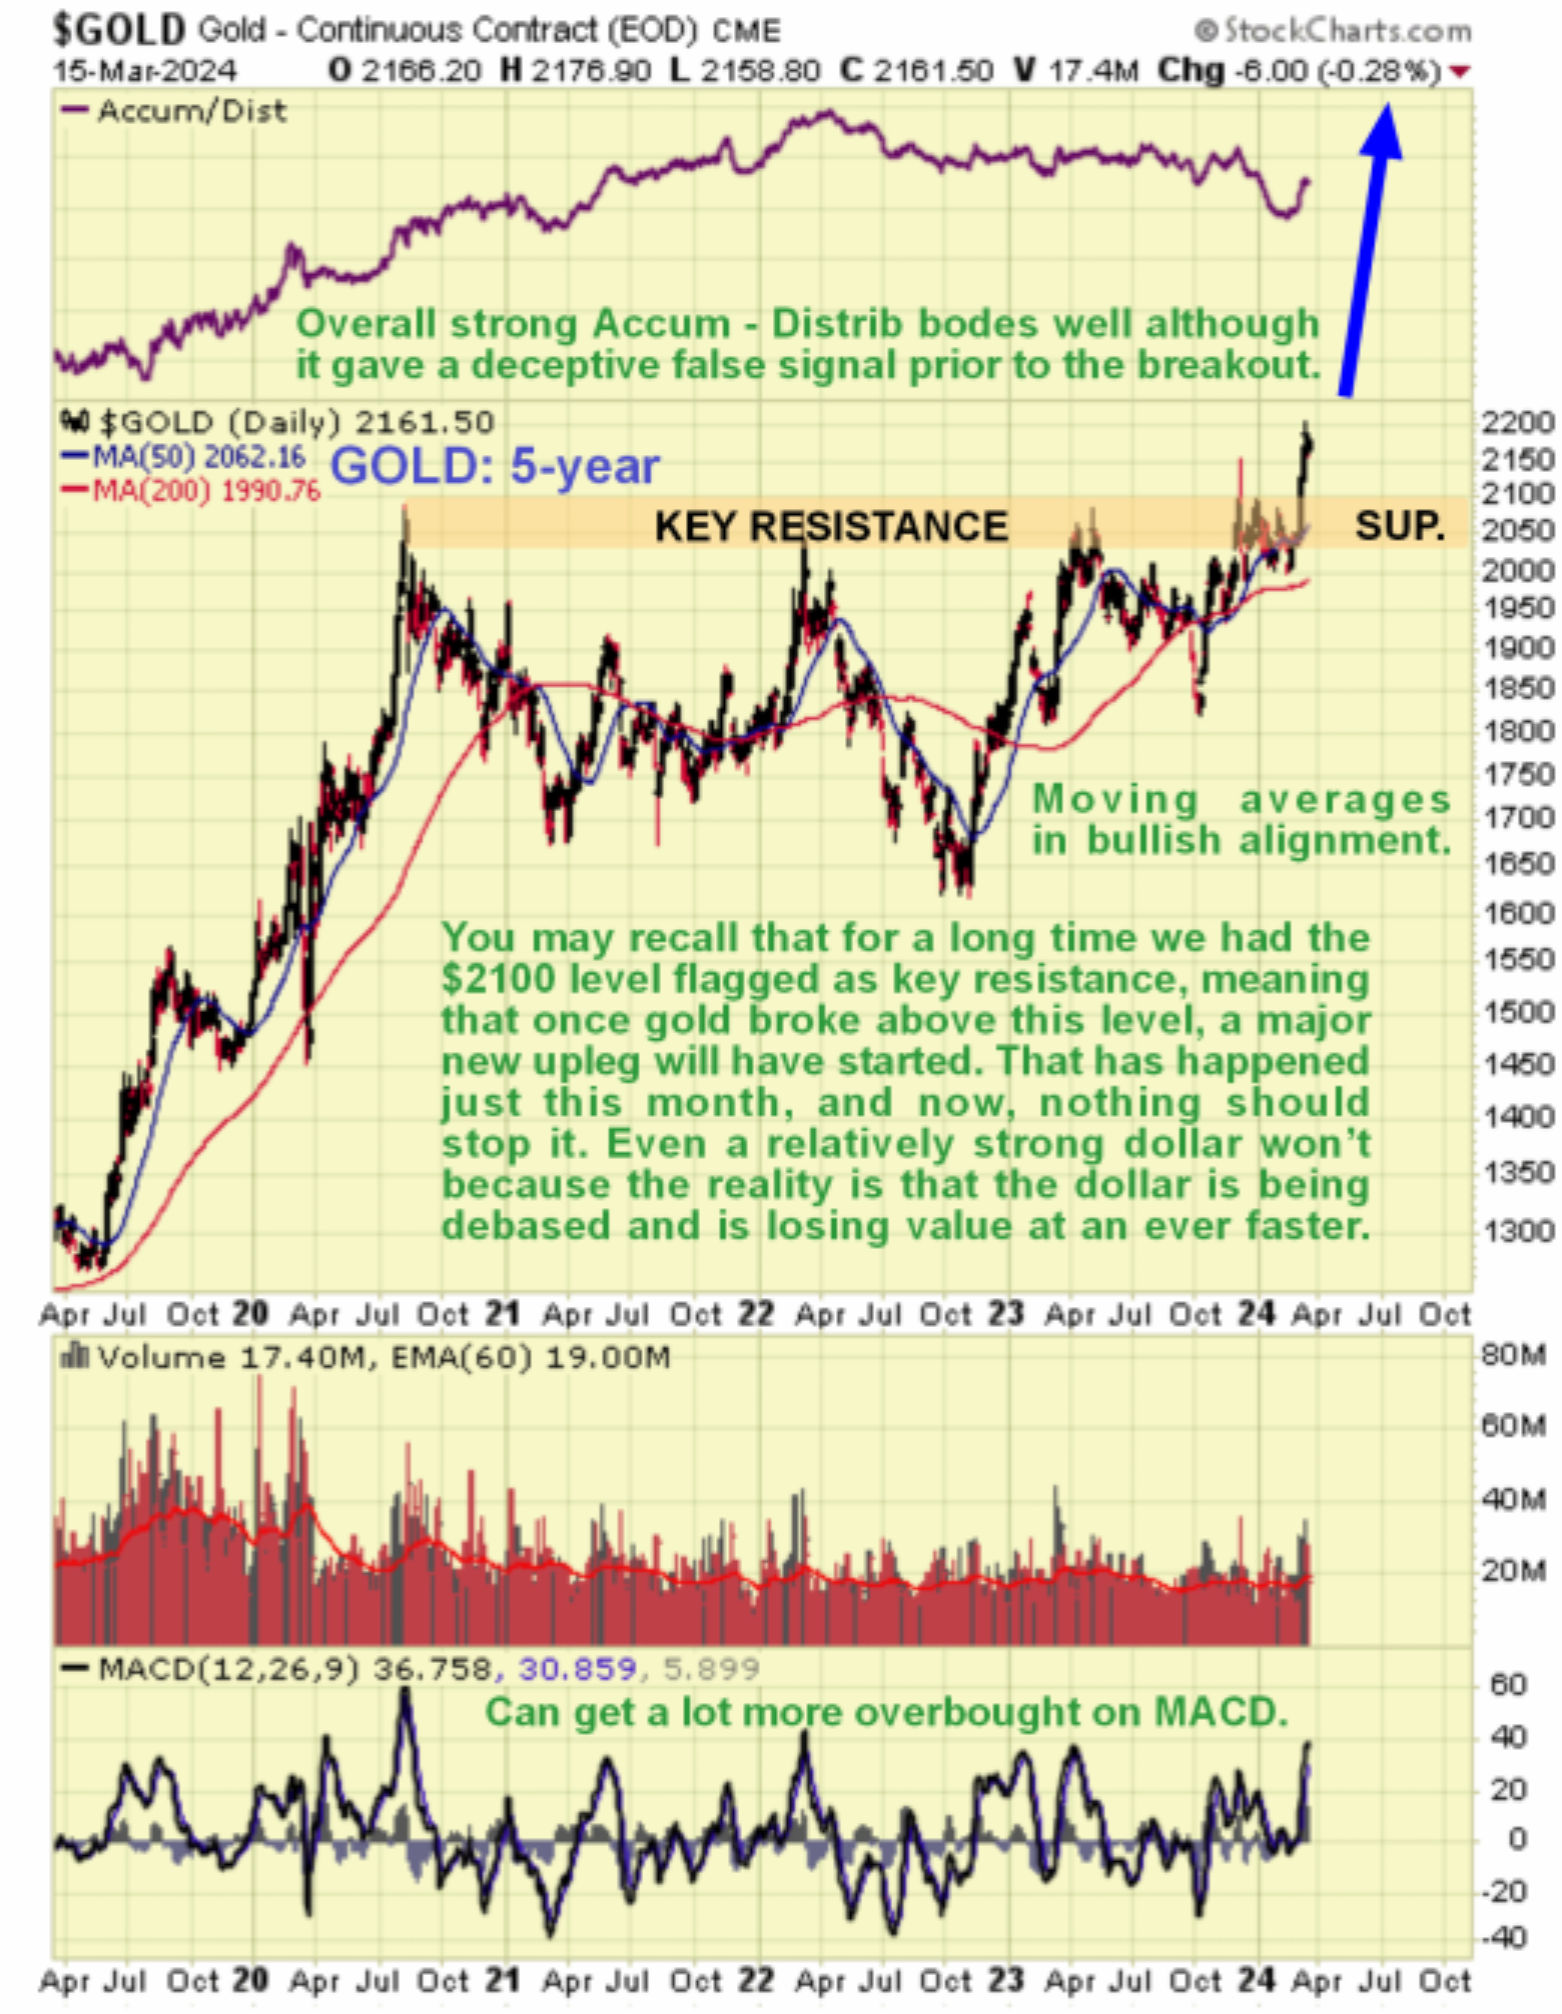
Now we will zoom in to examine the latter part of this gigantic base pattern using a 5-year chart, which shows the strong rally in 2019 and 2020 to form the right side of the Cup and then the lengthy Handle trading range that followed which continued right up to the end of last month. This chart makes clear the importance of the resistance level marking the horizontal upper boundary of the Handle trading range, as the price got turned back from the $2050 - $2100 level on four occasions but the last time this happened, early in December, the bullishly aligned moving averages were at hand, not far beneath to provide support and limit the reaction that followed. The Accumulation line fell hard on this retreat, however, giving a false signal that temporarily fooled us (me) and this may somehow have been staged to throw people off before the big move, or it may simply be that it did have negative implications that were quickly eclipsed by subsequent developments. In any event, gold made the big breakout on good volume this month which we will now look at in more detail on the 6-month chart.
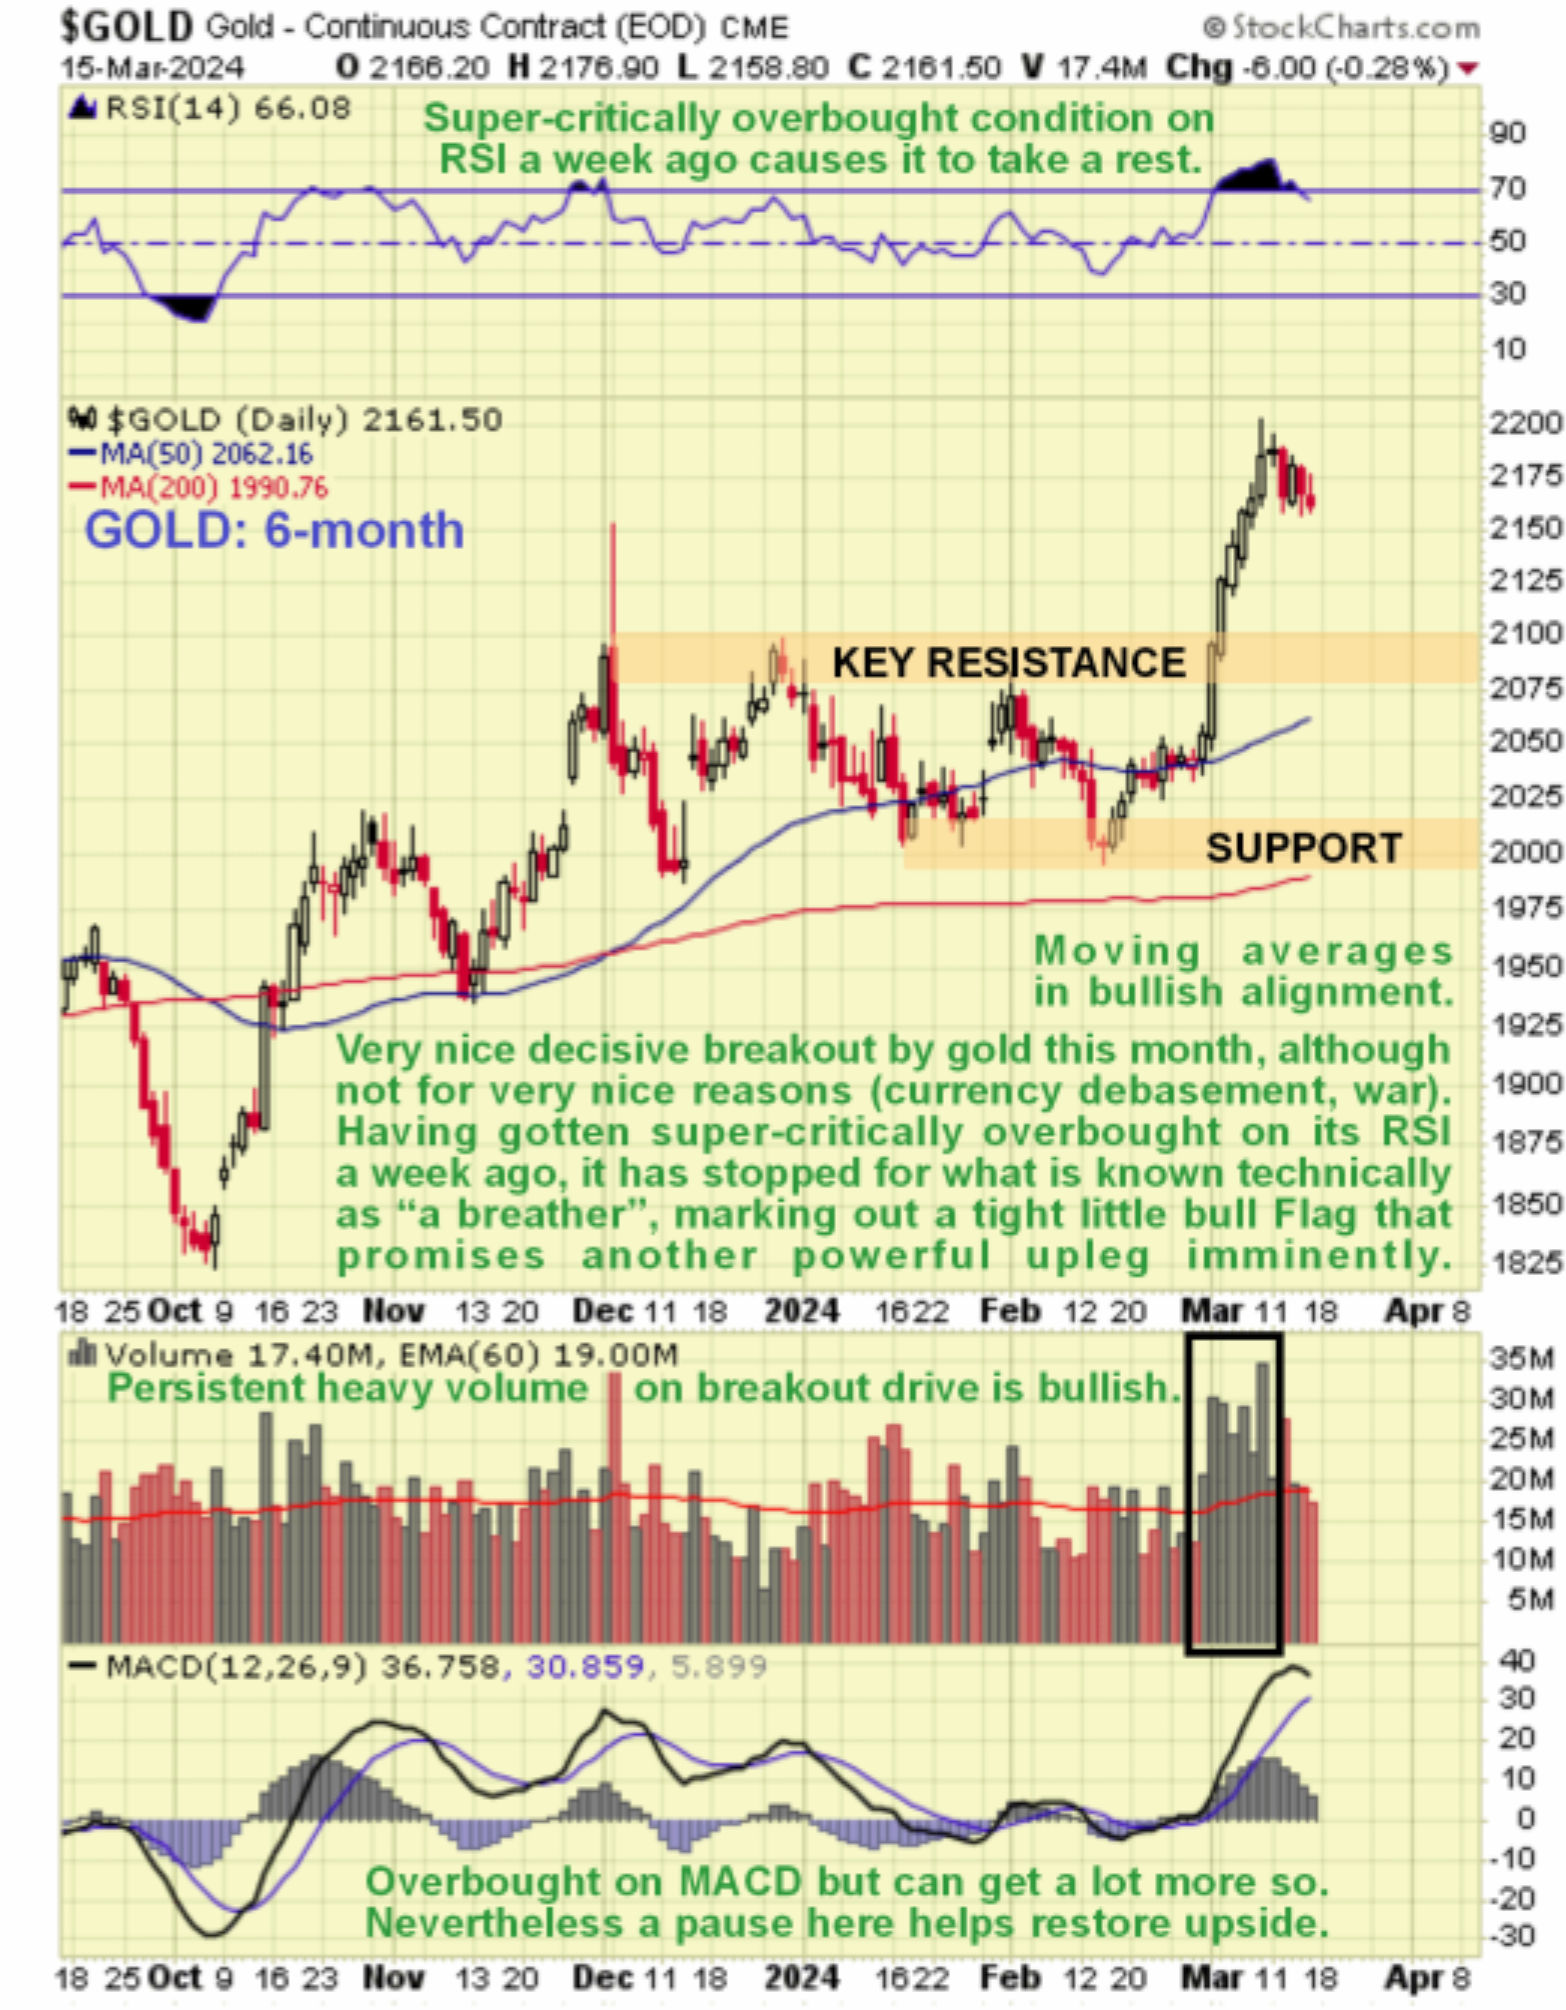
On the 6-month chart we can see to advantage gold’s powerful and decisive breakout on persistent strong volume and how it took it sharply higher to become super-critically overbought on its RSI indicator which is why it has stopped to “get its breath back” this past week. The resistance at $2100 has now deciisively fallen and with momentum positive and moving averages in strongly bullish alignment gold is now a bullmarket and for the reasons stated above it is likely to be one for the record books.
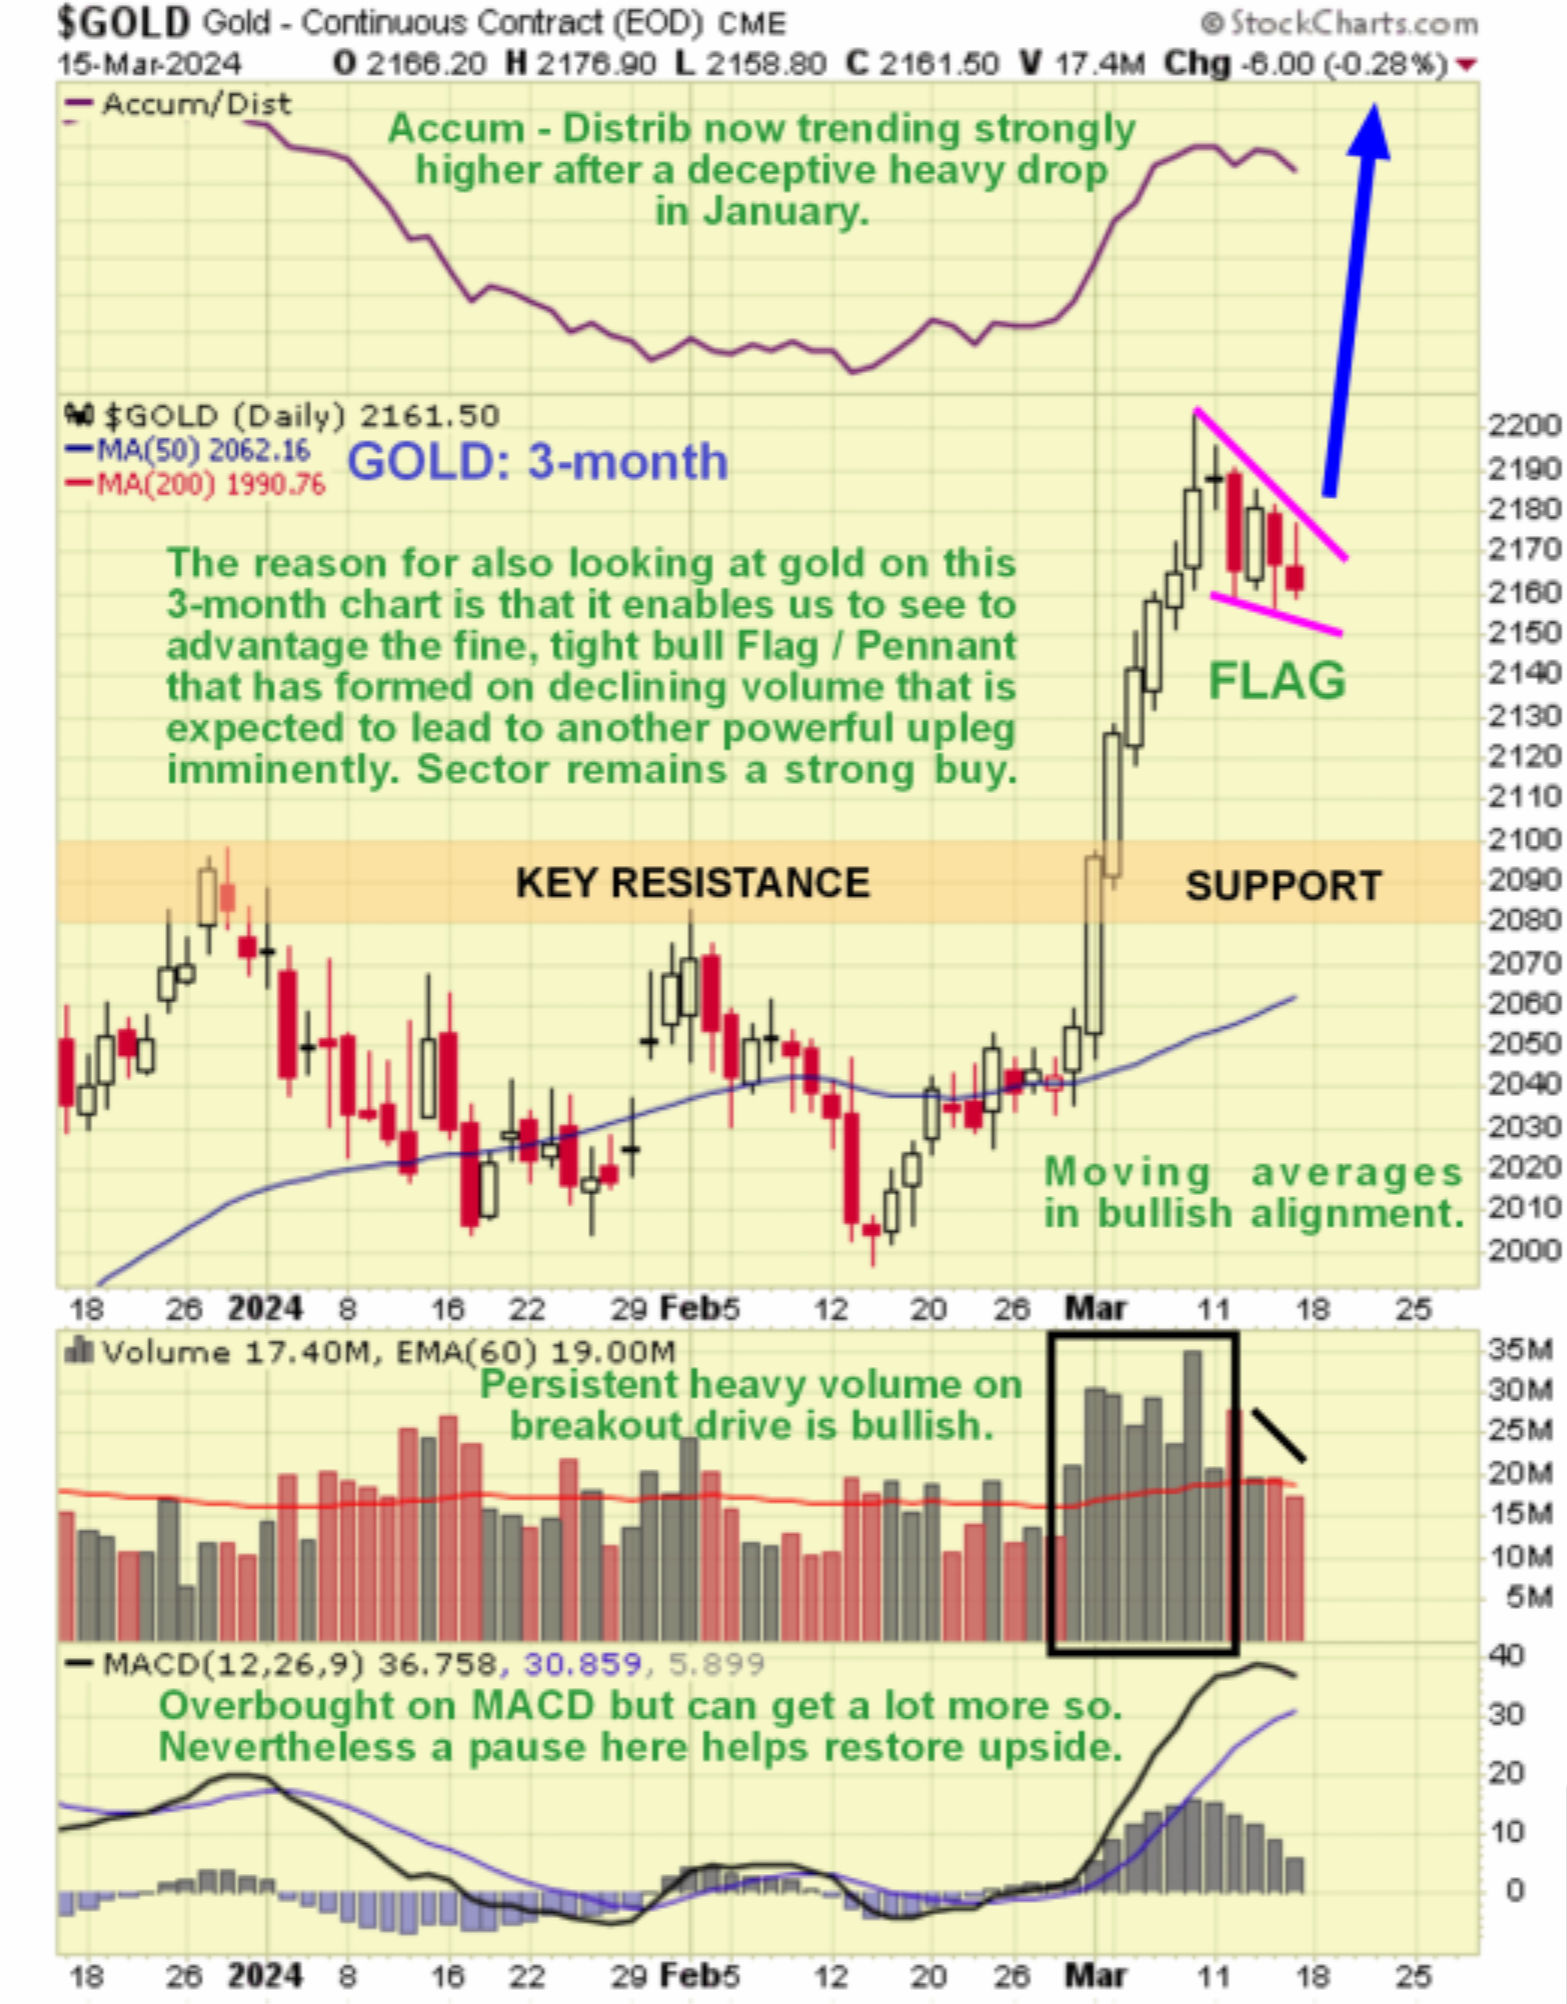
We will now proceed to look at gold again, this time on a shorter-term 3-month chart, the reason being to examine the price / volume action this month in an effort to determine what is going to happen next. The pattern that has formed as the price has reacted back slightly does not look like a top – price / volume action strongly suggests that it is a bull Flag / Pennant that will be followed by another strong upleg, similar in magnitude to the one that led into it and perhaps even stronger as gold is now in “open country” and moving away from the gravitational pull of the giant trading range. Volume has eased back in a most satisfactory manner during the past week with the MACD histogram (bars) also easing back considerably, suggesting that another big upleg is not just likely to happen soon, but imminent.
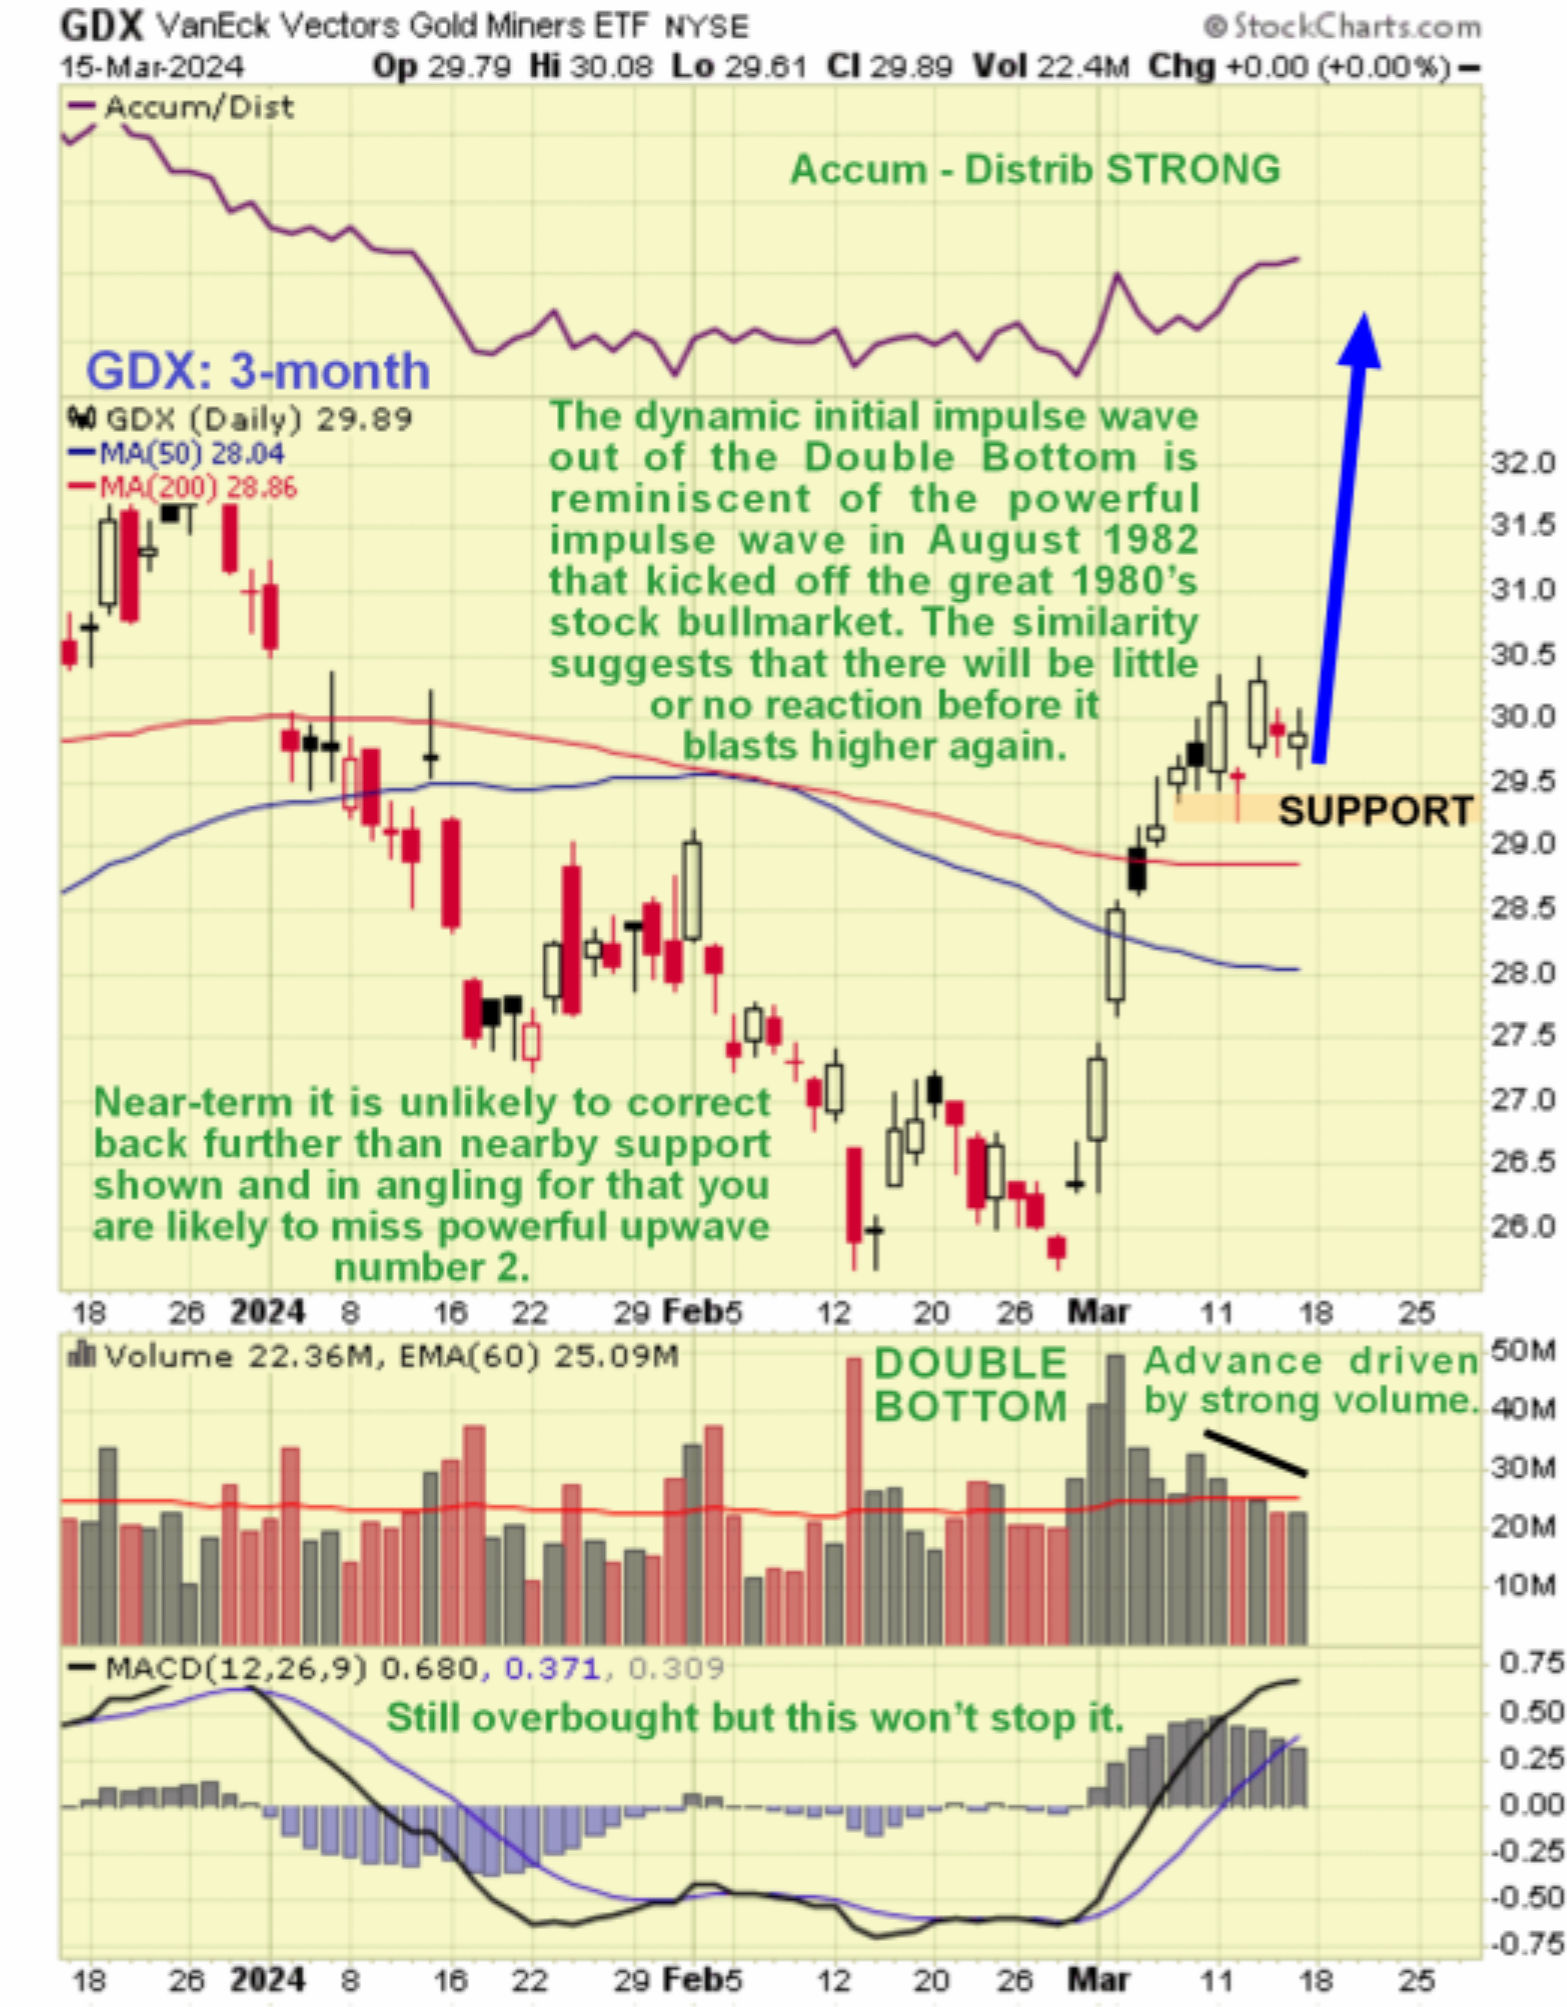
If gold looks like this on its 3-month chart, then what about gold stocks? Gold’s decisive breakout led to a powerful advance by gold stocks, as represented by the GDX ETF, whose 3-month chart shows a dynamic first impulse wave out of a Double Bottom, that was accompanied by high volume and gaps – this is very bullish. This waveform looks very like the first impulse wave in August of 1982 in the broad stockmarket that marked the start of the great 1980’s bullmarket which followed a decade of going nowhere (the 1970’s). On that occasion the market only reacted back a little – a lot less than many traders had expected and hoped for – before blasting higher again in a 2nd powerful impulse wave, and it never looked back. The lesson here is clear – if you are angling for a reaction back before buying the sector or adding to positions you are likely to be disappointed. The most it is likely to react back is to the minor support level near to $29.20 and it may not react back any more at all. From this position it could blast higher again almost without warning.
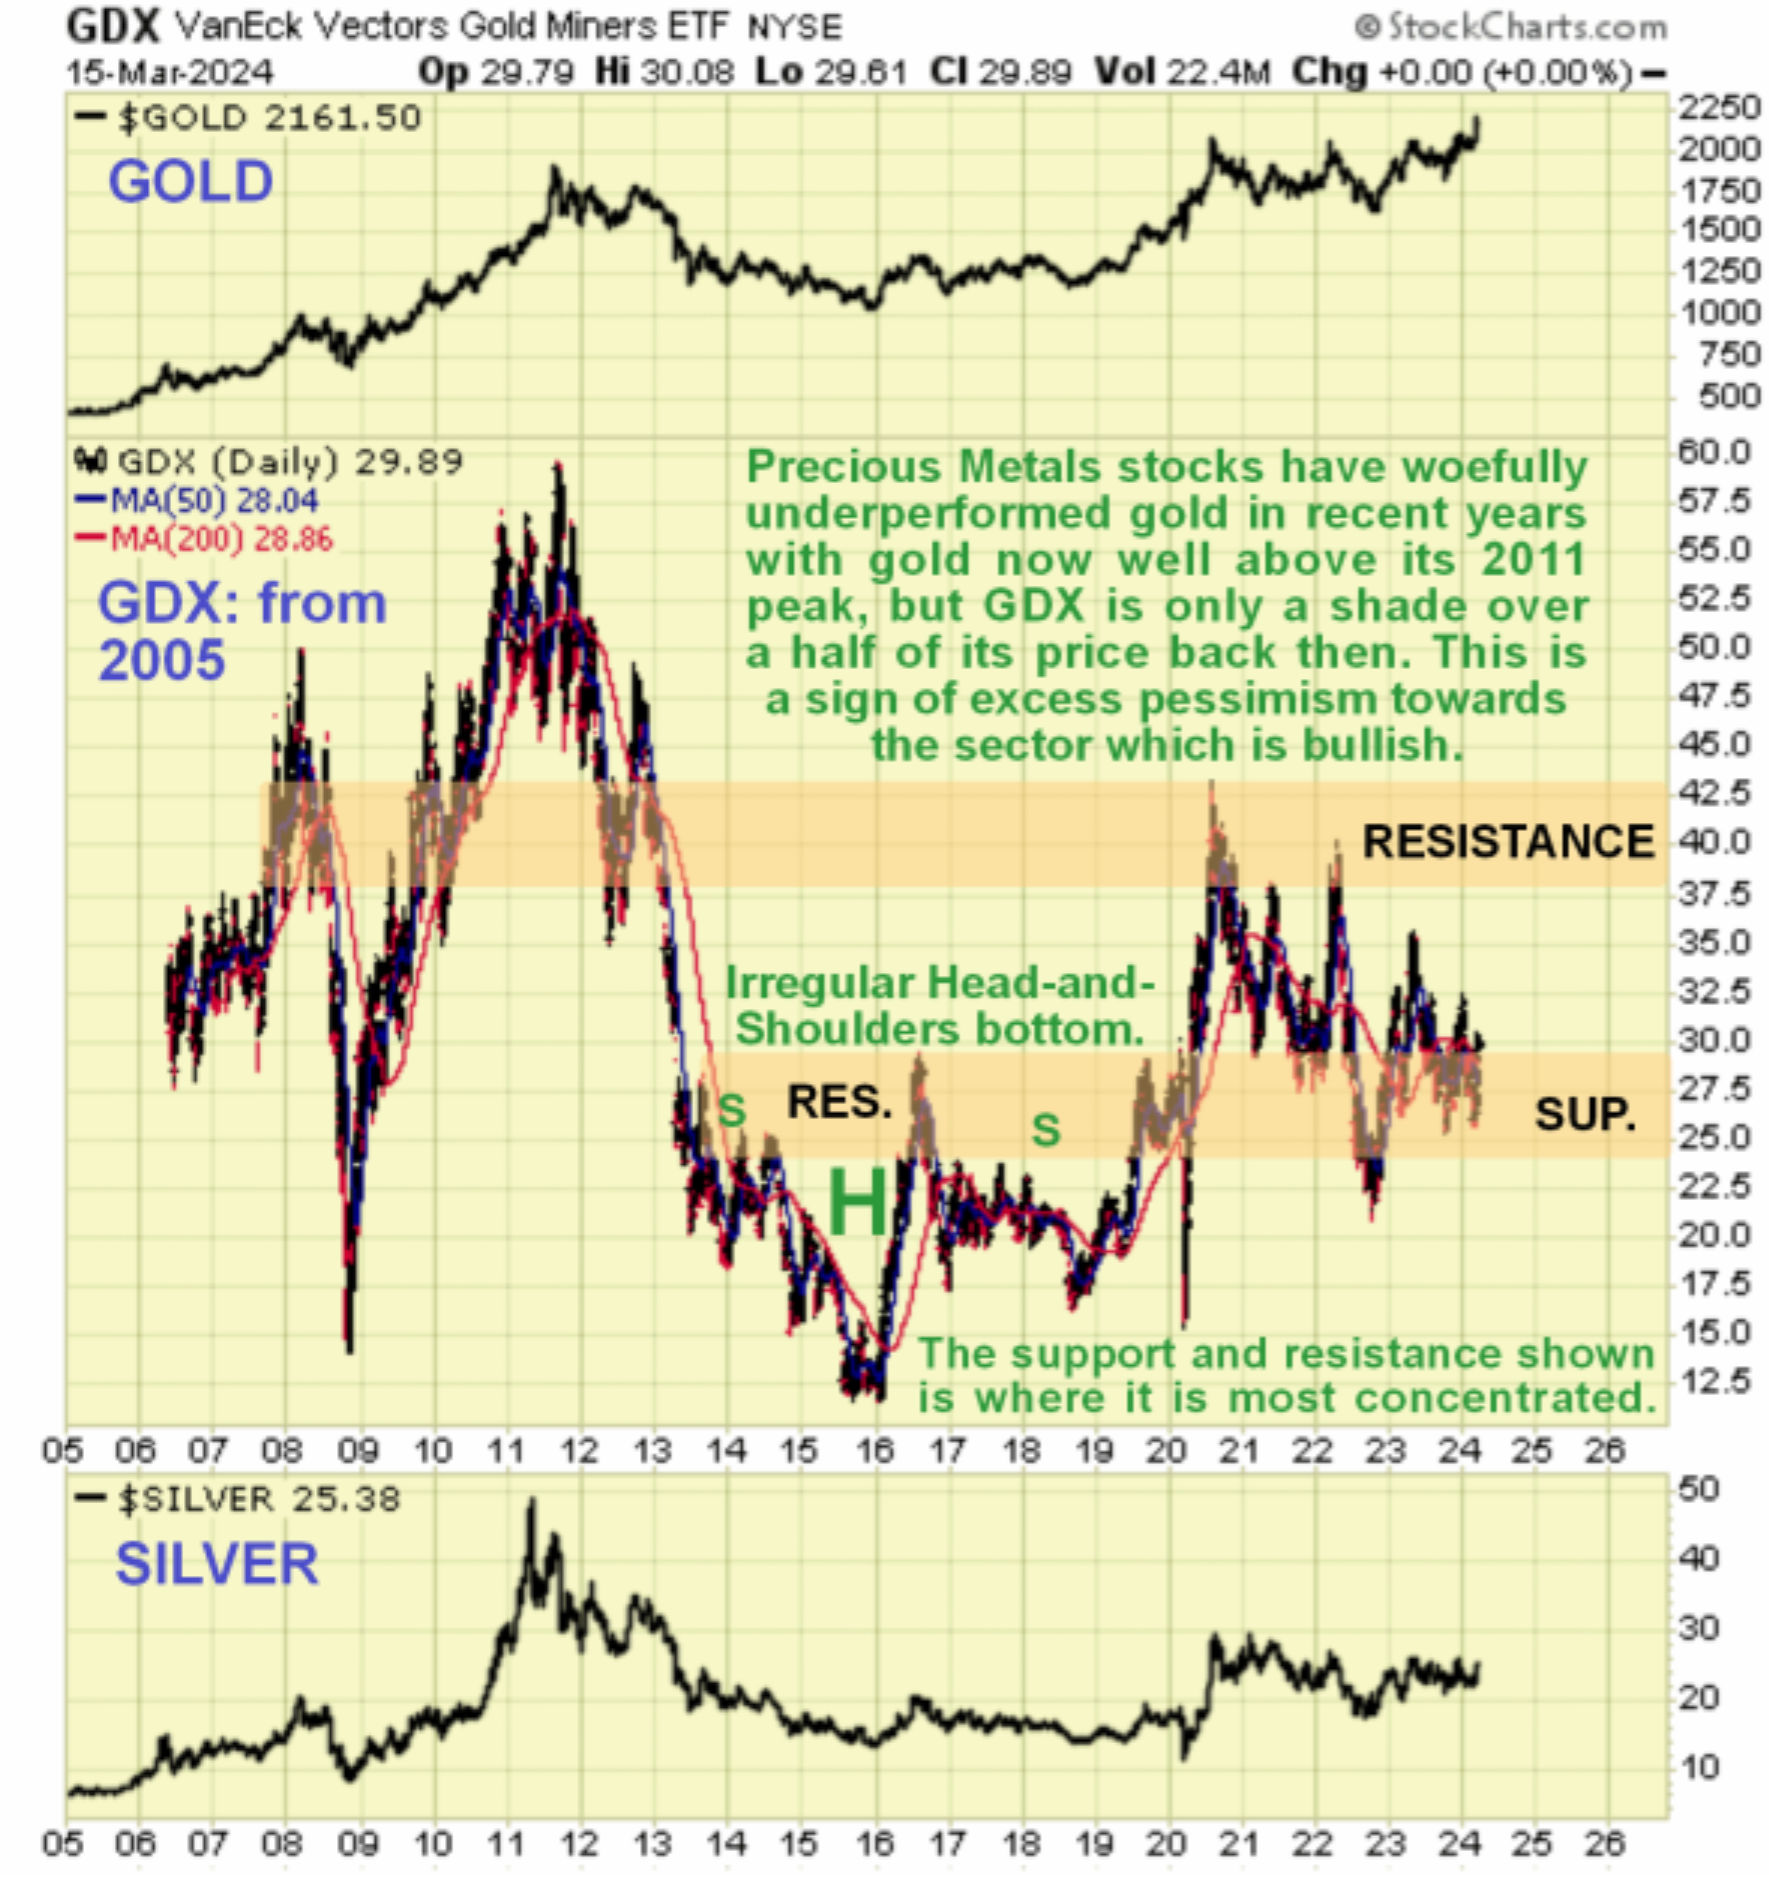
Adding fuel to the fire in a positive sense for gold (and silver) stocks is the fact that they are woefully undervalued relative to gold itself, as our chart for GDX going back to 2005 makes apparent. Gold is higher now than its 2011 peak, yet GDX, representing PM stocks, is about half the price it was in 2011, so it is clear that PM stocks have a lot of catching up to do and as gold continues to ascend they will attract growing speculative interest, eventually displaying the positive leverage to the gold price that they are famed for.
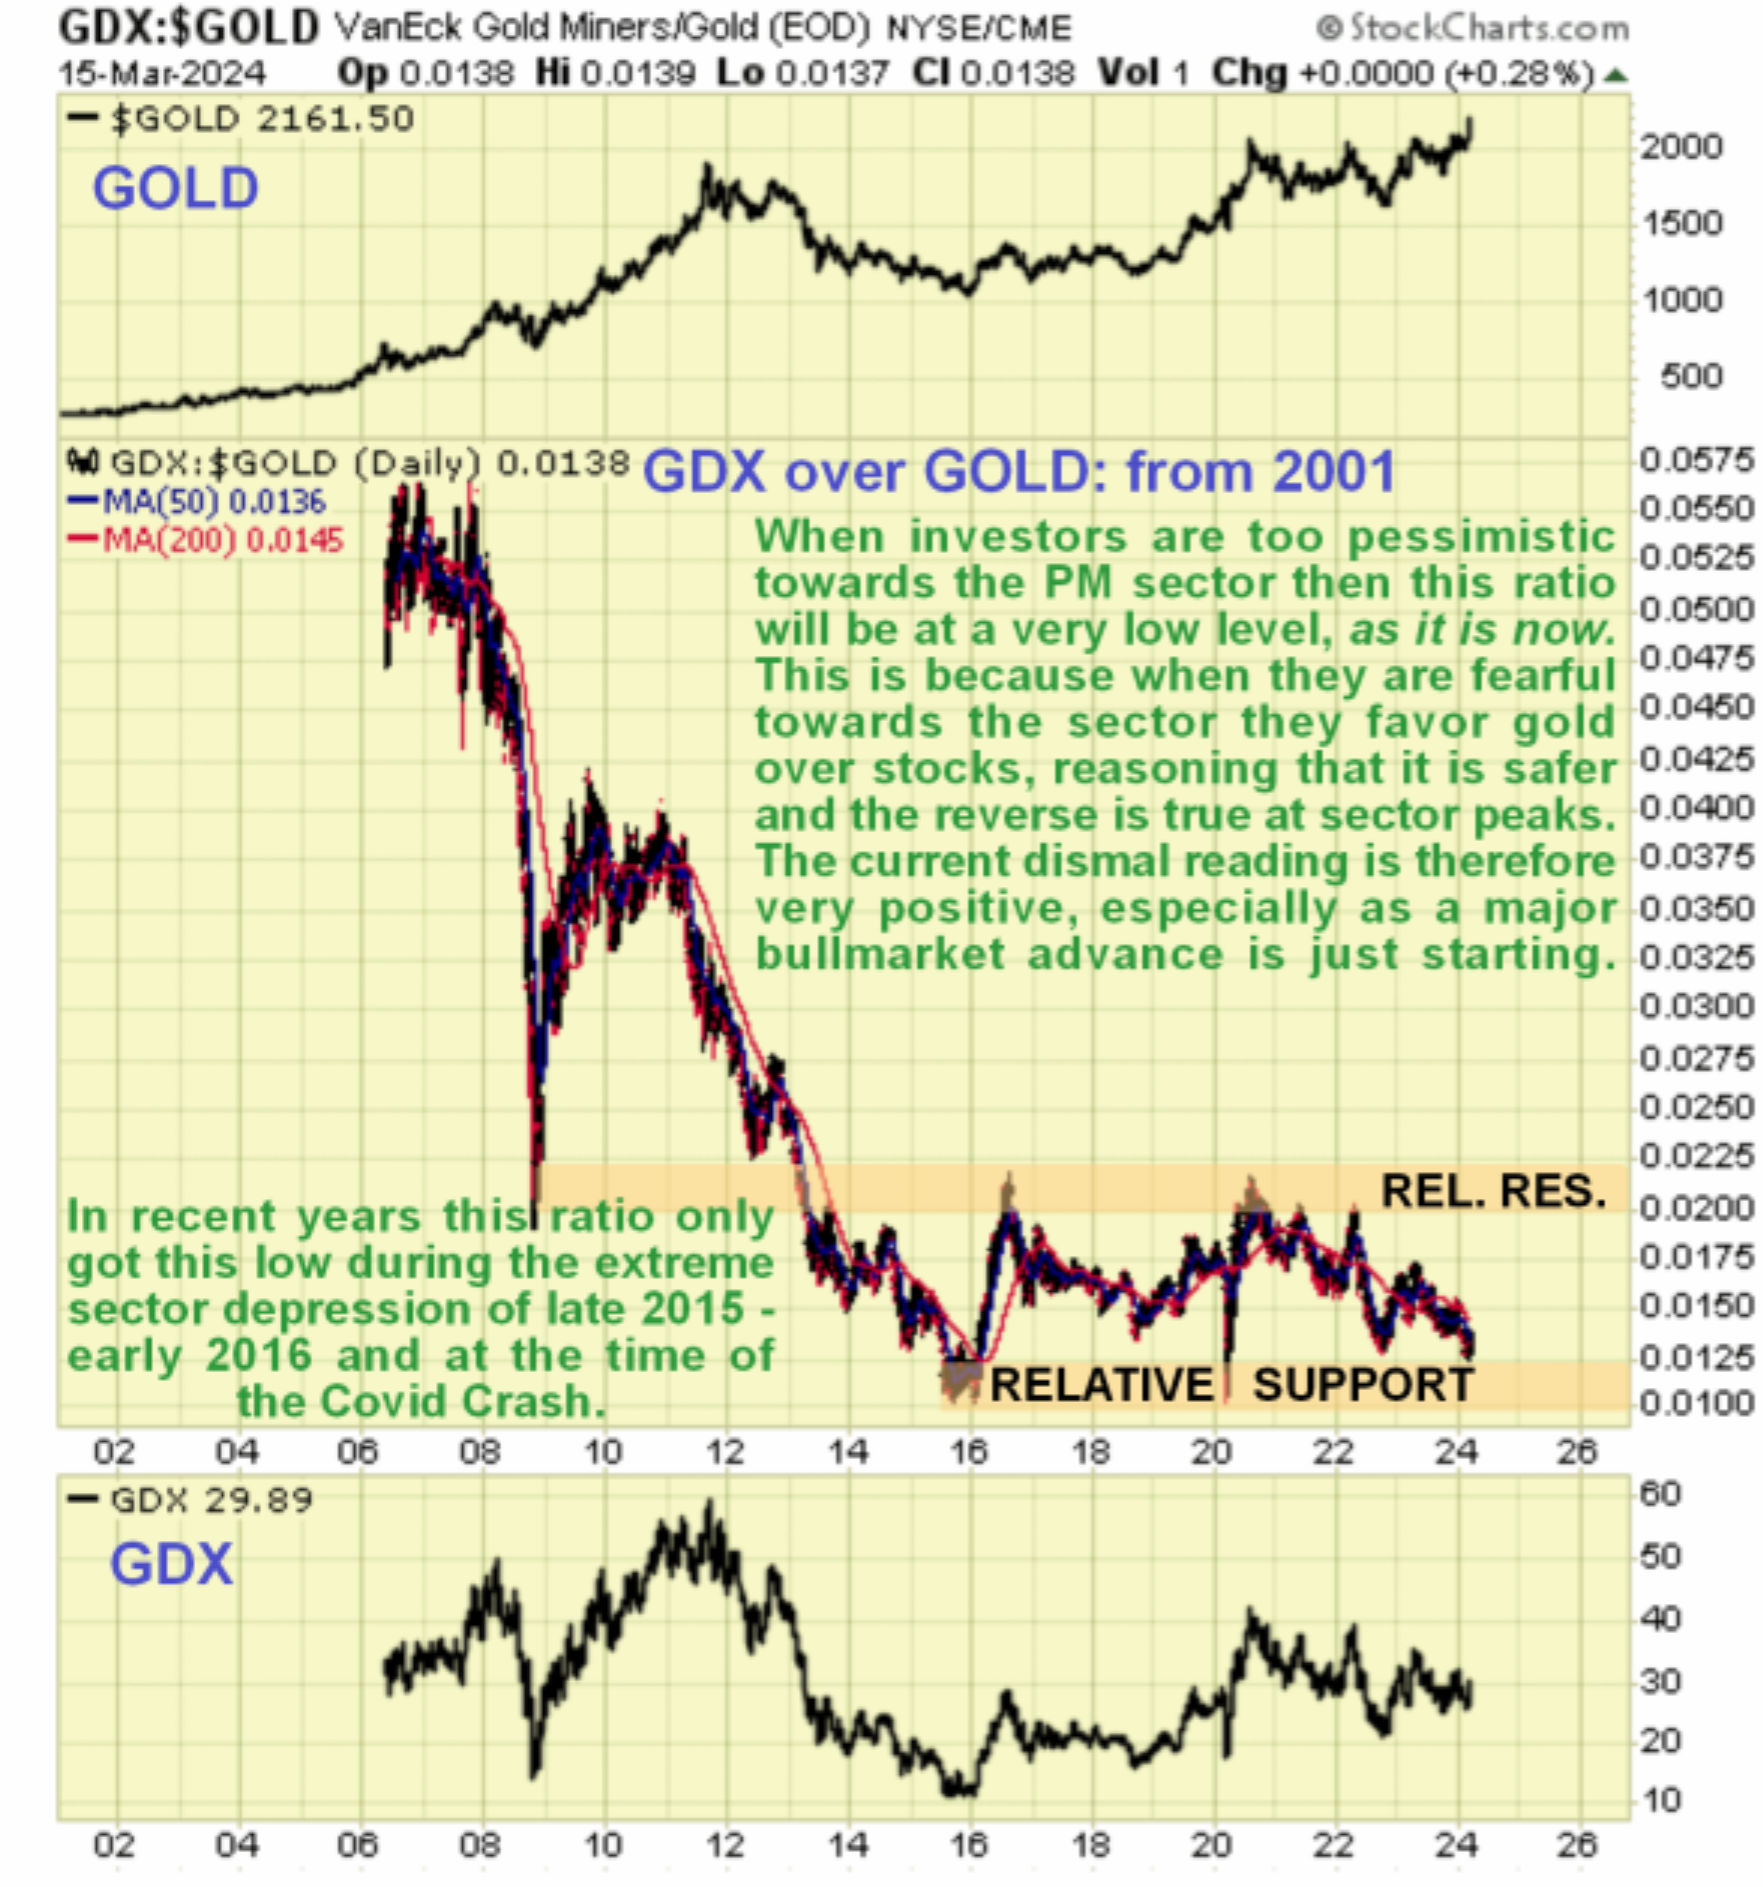
Lastly we can see how horribly undervalued Precious Metals stocks are relative to gold itself on our chart for GDX divided by gold going back to 2001. Only on two other occasions during the life of this chart have they been so undervalued – once at the nadir of the sector depression late in 2015 and early in 2016, and again at the depths of the Covid crash in the Spring of 2020 which was a freak event when the entire world was in the grip of an orchestrated mass psychosis. So, given that gold has entered a bullmarket that is likely to be of awesome magnitude, it should be clear that the upside potential of the better stocks in this sector is truly massive and that, despite their gains of the past couple of weeks they are still at exceedingly good prices compared to where they are headed.

*******

Clive P. Maund’s interest in markets started when, as an aimless youth searching for direction in his mid-20’s, he inherited some money. Unfortunately it was not enough to live a utopian lifestyle as a playboy or retire very young. Therefore on the advice of his brother, he bought a load of British Petroleum stock, which promptly went up 20% in the space of a few weeks. Clive sold them at the top…which really fired his imagination. The prospect of being able to buy securities and sell them later at a higher price, and make money for doing little or no work was most attractive – and so the quest began, especially as he had been further stoked up by watching from the sidelines with a mixture of fascination and envy as fortunes were made in the roaring gold and silver bull market of the late 70’s.
Clive furthered his education in Technical Analysis or charting by ordering various good books from the US and by applying what he learned at work on an everyday basis. He also obtained the UK Society of Technical Analysts’ Diploma.
The years following 2005 saw the boom phase of the Gold and Silver bull market, until they peaked in late 2011. While there is ongoing debate about whether that was the final high, it is not believed to be because of the continuing global debasement of fiat currency. The bear market since 2011 is viewed as being very similar to the 2-year reaction in the mid-70’s, which was preceded by a powerful advance and was followed by a gigantic parabolic price ramp. Moreover, Precious Metals should come back into their own when the various asset bubbles elsewhere burst, which looks set to happen anytime soon.
Visit Clive at his website: CliveMaund.com


